Waterfall Charts
Waterfall charts are used for visualizing level changes from an initial level to a final level through changes in the level. The changes are given as delta values, and you can have many intermediate totals, which are calculated automatically.
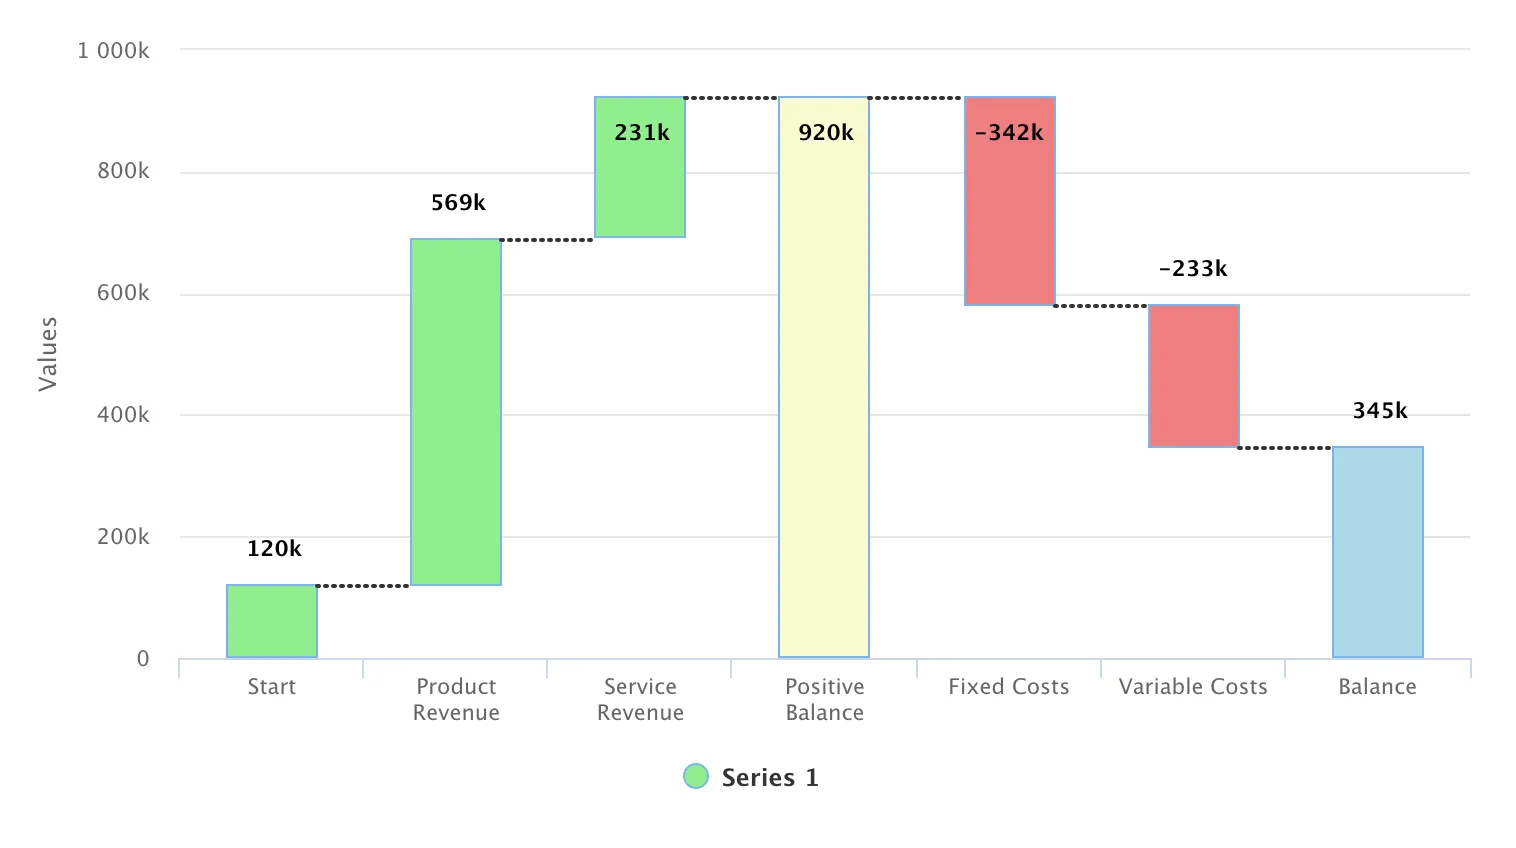
Waterfall charts have chart type WATERFALL.
For example:
Source code
Java
Chart chart = new Chart(ChartType.WATERFALL);

DataSeries dataSeries = new DataSeries();

dataSeries.add(new DataSeriesItem("Start", 120000));
dataSeries.add(new DataSeriesItem("Product Revenue", 569000));
dataSeries.add(new DataSeriesItem("Service Revenue", 231000));
WaterFallSum positiveBalance = new WaterFallSum("Positive Balance");
positiveBalance.setIntermediate(true);
dataSeries.add(positiveBalance);

dataSeries.add(new DataSeriesItem("Fixed Costs", -342000));
dataSeries.add(new DataSeriesItem("Variable Costs", -233000));
WaterFallSum balance = new WaterFallSum("Balance");
dataSeries.add(balance);

PlotOptionsWaterfall opts = new PlotOptionsWaterfall();
DataLabels dataLabels = new DataLabels(true);
dataLabels.setVerticalAlign(VerticalAlign.TOP);
dataLabels.setY(-30);
dataLabels.setFormatter("function() { return this.y / 1000 + 'k'; }");
opts.setDataLabels(dataLabels);

dataSeries.setPlotOptions(opts);

Configuration configuration = chart.getConfiguration();
configuration.addSeries(dataSeries);
configuration.getxAxis().setType(AxisType.CATEGORY);
...
Waterfall charts can be styled by CSS using the following classes: .highcharts-waterfall-series, .highcharts-point, .highcharts-negative, .highcharts-sum, .highcharts-intermediate-sum.
The example continues in the following subsections.
Plot Options
Waterfall charts have plot options type PlotOptionsWaterfall, which extends the more general options defined in PlotOptionsColumn. It has the following chart type specific properties:
upColor-
Color for positive values.
color-
Default color for all points. If
upColoris defined,coloris used only for negative values.
The following defines the colors, as well as the style and placement, of the labels for the columns:
Source code
Java
// Define the colors
final Color balanceColor = SolidColor.BLACK;
final Color positiveColor = SolidColor.BLUE;
final Color negativeColor = SolidColor.RED;

// Configure the colors
PlotOptionsWaterfall options = new PlotOptionsWaterfall();
options.setUpColor(positiveColor);
options.setColor(negativeColor);

// Configure the labels
Labels labels = new Labels(true);
labels.setVerticalAlign(VerticalAlign.TOP);
labels.setY(-20);
labels.setFormatter("Math.floor(this.y/1000) + 'k'");
Style style = new Style();
style.setColor(SolidColor.BLACK);
style.setFontWeight(FontWeight.BOLD);
labels.setStyle(style);
options.setDataLabels(labels);
options.setPointPadding(0);
conf.setPlotOptions(options);
Data Series
The data series for waterfall charts consist of changes (deltas) starting from an initial value and one or more cumulative sums. There should be at least a final sum, and optionally intermediate sums. The sums are represented as WaterFallSum data items, and no value is needed for them, as they are calculated automatically. For intermediate sums, you should set the intermediate property to true.
Source code
Java
// The data
DataSeries series = new DataSeries();

// The beginning balance
DataSeriesItem start = new DataSeriesItem("Start", 306503);
start.setColor(balanceColor);
series.add(start);

// Deltas
series.add(new DataSeriesItem("Predators", -3330));
series.add(new DataSeriesItem("Slaughter", -103332));
series.add(new DataSeriesItem("Reproduction", +104052));

WaterFallSum end = new WaterFallSum("End");
end.setColor(balanceColor);
end.setIntermediate(false); // Not intermediate (default)
series.add(end);

conf.addSeries(series);