Solid Gauges
A solid gauge is much like a regular gauge – a one-dimensional chart with a circular Y-axis. However, instead of a rotating pointer, the value is shown by a rotating arc with a solid color. The color of the indicator arc can be configured to change according to the value, using color stops.
Consider the following gauge:
Source code
Java
Chart chart = new Chart(ChartType.SOLIDGAUGE);With the settings shown in the following sections, it is displayed as in A Solid Gauge.
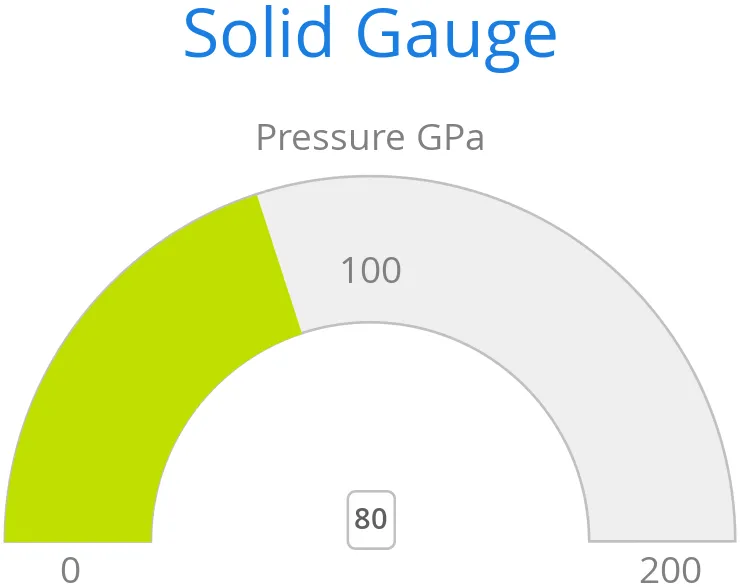
Although solid gauge is much like a regular gauge, the configuration differs.
Configuration
The solid gauge must be configured in the drawing Pane of the chart configuration. The gauge arc spans an angle which is specified as -360 to 360 degrees, with 0 degrees at the top of the arc. Typically, a semi-arc is used, where you use -90 and 90 for the angles, and move the center lower than you would have with a full circle. You can also adjust the size of the gauge pane; enlarging it allows better positioning of the tick labels.
Source code
Java
Configuration conf = chart.getConfiguration();
conf.setTitle("Solid Gauge");

Pane pane = conf.getPane();
pane.setSize("125%");           // For positioning tick labels
pane.setCenter("50%", "70%"); // Move center lower
pane.setStartAngle(-90);        // Make semi-circle
pane.setEndAngle(90);           // Make semi-circle
The shape of the gauge display is defined as the background of the pane. As a minimum, you need to set the shape as either " arc`" or "[literal]solid`". You also typically want to set background color and inner and outer radius.
Source code
Java
Background bkg = new Background();
bkg.setInnerRadius("60%");  // To make it an arc and not circle
bkg.setOuterRadius("100%"); // Default - not necessary
bkg.setShape(BackgroundShape.ARC);        // solid or arc
pane.setBackground(bkg);
Axis Configuration
A gauge has only a Y-axis. You must define the value range ( min and max).
Source code
Java
YAxis yaxis = new YAxis();
yaxis.setTitle("Pressure GPa");
yaxis.getTitle().setY(-80); // Move 70 px upwards from center

// The limits are mandatory
yaxis.setMin(0);
yaxis.setMax(200);

// Configure ticks and labels
yaxis.setTickInterval(100);  // At 0, 100, and 200
yaxis.getLabels().setY(-16); // Move 16 px upwards
yaxis.setGridLineWidth(0); // Disable grid
Calling yaxis.getLabels().setRotationPerpendicular() makes gauge labels rotate perpendicular to the center.
You can make all kinds of other configuration settings on the axis. See the API documentation for all the available parameters.
Plot Options
Solid gauges don’t currently have any chart-type-specific plot options. See "Plot Options" for common options.
Source code
Java
PlotOptionsSolidgauge options = new PlotOptionsSolidgauge();

// Move the value display box at the center a bit higher
Labels dataLabels = new Labels();
dataLabels.setY(-20);
options.setDataLabels(dataLabels);

conf.setPlotOptions(options);
Setting & Updating Gauge Data
A gauge displays only a single value, which you can define as a data series of length 1, as in the following example:
Source code
Java
ListSeries series = new ListSeries("Pressure MPa", 80);
conf.addSeries(series);
Gauges are especially meaningful for displaying changing values. You can use the updatePoint() method in the data series to update the single value.
Source code
Java
final TextField tf = new TextField("Enter a new value");
layout.add(tf);

Button update = new Button("Update", (e) -> {
    Integer newValue = new Integer(tf.getValue());
    series.updatePoint(0, newValue);
});
layout.add(update);