Box Plot Charts
Box plot charts display the distribution of statistical variables. A data point has a median, represented with a horizontal line, upper and lower quartiles, represented by a box, and a low and high value, represented with T-shaped "whiskers". The exact semantics of the box symbols are up to you.
Box plot chart is related to the error bar chart described in Error Bars, sharing the box and whisker elements.
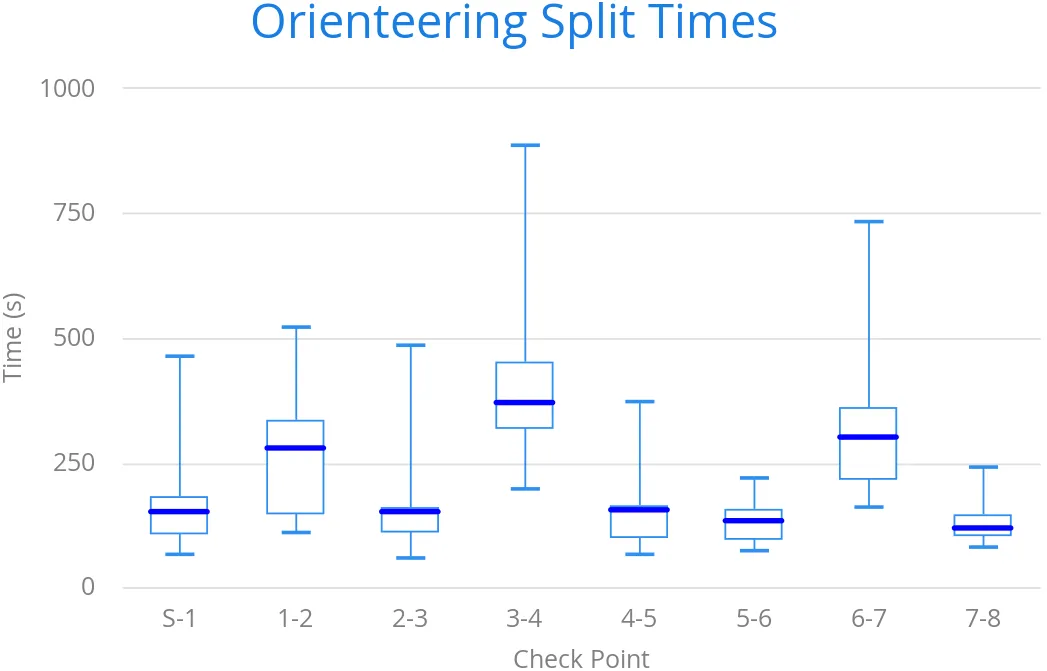
The chart type for box plot charts is ChartType.BOXPLOT. You normally have only one data series, so it’s meaningful to disable the legend.
Source code
Java
Chart chart = new Chart(ChartType.BOXPLOT);

// Modify the default configuration a bit
Configuration conf = chart.getConfiguration();
conf.setTitle("Orienteering Split Times");
conf.getLegend().setEnabled(false);
Plot Options
The plot options for box plots have type PlotOptionsBoxPlot, which extends the more generic PlotOptionsErrorBar.
For example:
Source code
Java
// Set median line color and thickness
PlotOptionsBoxplot plotOptions = new PlotOptionsBoxplot();
plotOptions.setWhiskerLength("80%");
conf.setPlotOptions(plotOptions);
Data Model
As the data points in box plots have five different values instead of the usual one, they require you to use a special BoxPlotItem. You can give the different values with the setters, or all at once in the constructor.
Source code
Java
// Orienteering control point times for runners
double data[][] = orienteeringdata();

DataSeries series = new DataSeries();
for (double cpointtimes[]: data) {
    StatAnalysis analysis = new StatAnalysis(cpointtimes);
    series.add(new BoxPlotItem(analysis.low(),
                               analysis.firstQuartile(),
                               analysis.median(),
                               analysis.thirdQuartile(),
                               analysis.high()));
}
conf.setSeries(series);