Heat Maps
A heat map is a two-dimensional grid, where the color of a grid cell reflects a value.
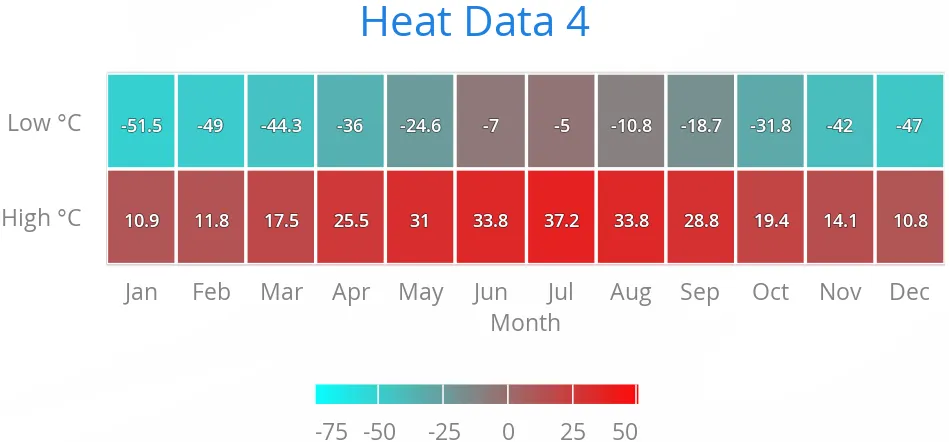
Heat maps have chart type HEATMAP.
For example:
Source code
Java
Chart chart = new Chart(ChartType.HEATMAP);
chart.setWidth("600px");
chart.setHeight("300px");

Configuration conf = chart.getConfiguration();
conf.setTitle("Heat Data");

// Set colors for the extremes
conf.getColorAxis().setMinColor(SolidColor.AQUA);
conf.getColorAxis().setMaxColor(SolidColor.RED);

// Set up border and data labels
PlotOptionsHeatmap plotOptions = new PlotOptionsHeatmap();
plotOptions.setBorderColor(SolidColor.WHITE);
plotOptions.setBorderWidth(2);
plotOptions.setDataLabels(new DataLabels(true));
conf.setPlotOptions(plotOptions);

// Create some data
HeatSeries series = new HeatSeries();
series.addHeatPoint( 0, 0,  10.9); // Jan High
series.addHeatPoint( 0, 1, -51.5); // Jan Low
series.addHeatPoint( 1, 0,  11.8); // Feb High
...
series.addHeatPoint(11, 1, -47.0); // Dec Low
conf.addSeries(series);

// Set the category labels on the X axis
XAxis xaxis = new XAxis();
xaxis.setTitle("Month");
xaxis.setCategories("Jan", "Feb", "Mar",
    "Apr", "May", "Jun", "Jul", "Aug", "Sep",
    "Oct", "Nov", "Dec");
conf.addxAxis(xaxis);

// Set the category labels on the Y axis
YAxis yaxis = new YAxis();
yaxis.setTitle("");
yaxis.setCategories("High C", "Low C");
conf.addyAxis(yaxis);
Heat Map Data Series
Heat maps require two-dimensional tabular data. The easiest way is to use HeatSeries, as was done in the earlier example. You can add data points with the addHeatPoint() method, or give all the data at once in an array with setData() or in the constructor.
If you need to use another data series type for a heat map, the semantics of the heat map data points are currently not supported by the general-purpose series types, such as DataSeries. You can work around this semantic limitation by specifying the X (column), Y (row), and heatScore by using the respective X, low, and high properties of the general-purpose data series.
While some other data series types allow updating the values one by one, updating all the values in a heat map is very inefficient; it’s faster to replace the data series and then call chart.drawChart().