Polygons
Freeform filled or stroked shapes drawn in the Cartesian plane.
A polygon can be used to draw any freeform filled or stroked shape in the Cartesian plane.
Polygons consist of connected data points. DataSeries or ContainerSeries are usually the most meaningful data series types for polygon charts. In both cases, the x and y properties should be set.
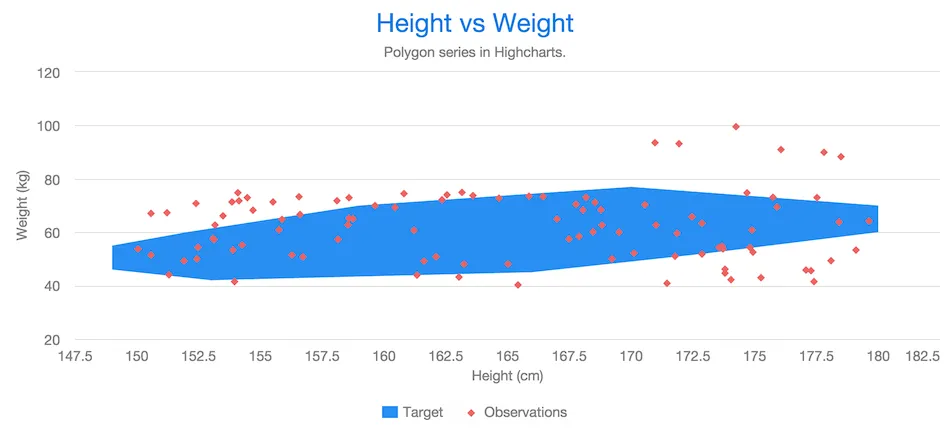
Polygon Combined with Scatter
Polygons have chart type POLYGON.
For example:
Source code
Java
Chart chart = new Chart();
Configuration conf = chart.getConfiguration();
conf.setTitle("Height vs Weight");

XAxis xAxis = conf.getxAxis();
xAxis.setStartOnTick(true);
xAxis.setEndOnTick(true);
xAxis.setShowLastLabel(true);
xAxis.setTitle("Height (cm)");

YAxis yAxis = conf.getyAxis();
yAxis.setTitle("Weight (kg)");

PlotOptionsScatter optionsScatter = new PlotOptionsScatter();
DataSeries scatter = new DataSeries();
scatter.setPlotOptions(optionsScatter);
scatter.setName("Observations");

scatter.add(new DataSeriesItem(160, 67));
...
scatter.add(new DataSeriesItem(180, 75));
conf.addSeries(scatter);

DataSeries polygon = new DataSeries();
PlotOptionsPolygon optionsPolygon = new PlotOptionsPolygon();
optionsPolygon.setEnableMouseTracking(false);
polygon.setPlotOptions(optionsPolygon);
polygon.setName("Target");

polygon.add(new DataSeriesItem(153, 42));
polygon.add(new DataSeriesItem(149, 46));
...
polygon.add(new DataSeriesItem(173, 52));
polygon.add(new DataSeriesItem(166, 45));
conf.addSeries(polygon);
Plot Options
Polygon chart options can be configured in a PlotOptionsPolygon object, although it doesn’t have any chart-type-specific options.