X-Range Charts
Charts that visualize a range on the X axis.
X-Range charts are used to visualize a range on the X axis. They require the use of DataSeriesItemXrange to set an initial X value and a final X2 value. Additionally, partialFillAmount can be set to show the percentage of the point to be filled.
A ready X-Range chart is shown in X-Range Chart.
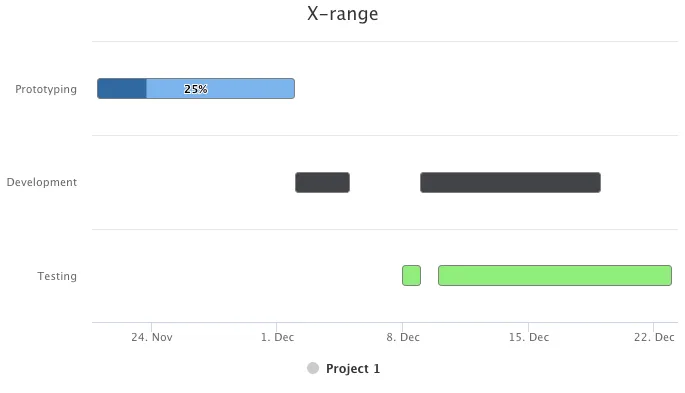
X-Range Chart
The chart type of an X-Range chart is ChartType.XRANGE. Its options can be configured in a PlotOptionsXrange object.
Source code
Java
// Create a xrange chart
Chart chart = new Chart(ChartType.XRANGE);

// Modify the default configuration
Configuration conf = chart.getConfiguration();
conf.setTitle("X-range");

// Add data
DataSeries series = new DataSeries();
series.setName("Project 1");
series.add(new DataSeriesItemXrange(getInstant(2014, 11, 21),
        getInstant(2014, 12, 2), 0, 0.25));
series.add(new DataSeriesItemXrange(getInstant(2014, 12, 2),
        getInstant(2014, 12, 5), 1));
series.add(new DataSeriesItemXrange(getInstant(2014, 12, 8),
        getInstant(2014, 12, 9), 2));
series.add(new DataSeriesItemXrange(getInstant(2014, 12, 9),
        getInstant(2014, 12, 19), 1));
series.add(new DataSeriesItemXrange(getInstant(2014, 12, 10),
        getInstant(2014, 12, 23), 2));
PlotOptionsXrange options = new PlotOptionsXrange();
options.setBorderColor(SolidColor.GRAY);
options.setPointWidth(20);
options.getDataLabels().setEnabled(true);
series.setPlotOptions(options);
conf.addSeries(series);

// Configure the axes
conf.getxAxis().setType(AxisType.DATETIME);
conf.getyAxis().setTitle("");
conf.getyAxis().setCategories("Prototyping", "Development", "Testing");
conf.getyAxis().setReversed(true);
Source code
Java
// Helper method to create an Instant from year, month and day
private Instant getInstant(int year, int month, int dayOfMonth) {
    return LocalDate.of(year, month, dayOfMonth).atStartOfDay().toInstant(ZoneOffset.UTC);
}