Chart Styling
- Chart Styling
- Style Properties
Charts can be styled using CSS, and in Flow applications also through the Java API. Vaadin Charts also has many built-in theme variants.
|
Caution
|
Both CSS and Java styling API can’t be used in the same chart
While no error is thrown if different styling methods are used in the same chart, only one method should be used in any chart, since having both could lead to unexpected results.
|
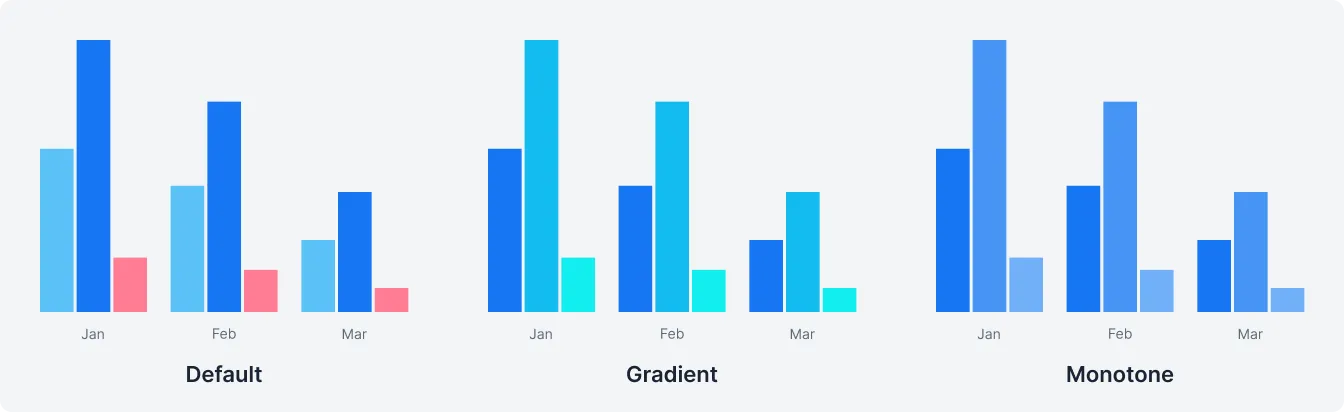
Theme Variants
The following theme variants are available for Charts:
-
Default colors (based on the Lumo or Material theme)
-
Gradient variant with colors varying in hue (
theme="gradient"/ChartVariant.LUMO_GRADIENT/MATERIAL_GRADIENT) -
Monotone variant with colors varying in brightness (
theme="monotone"/ChartVariant.LUMO_MONOTONE/MATERIAL_MONOTONE) -
Classic variant with colors matching those in older versions (
theme="classic"/ChartVariant.LUMO_CLASSIC/MATERIAL_CLASSIC)
See a live demo of the variants.
Java Styling API in Flow
The default styling mode in Flow applications uses the Java API. See the Java API reference for details.
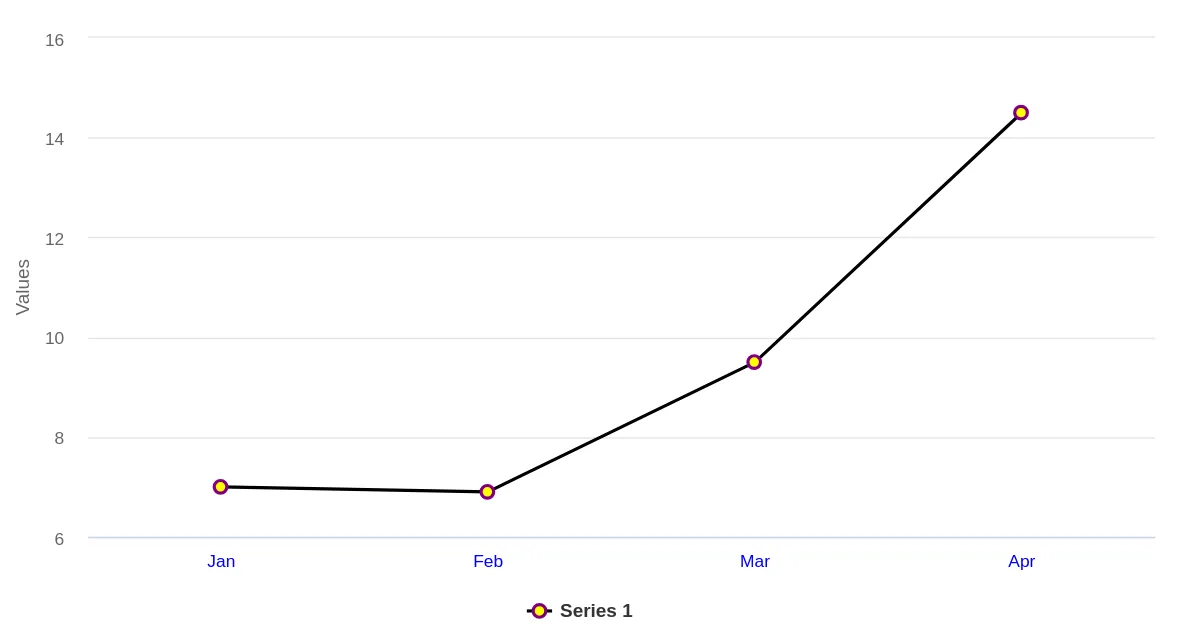
Styling Using Java API Example
In this example Java API is used to change the color of point markers to yellow, their outline to purple, x-axis labels to blue, and the line color to black.
Source code
FlowStyleExample.java
FlowStyleExample.javapublic class FlowStyleExample extends Div {
public FlowStyleExample() {
Chart chart = new Chart();
Configuration configuration = chart.getConfiguration();
DataSeries ds = new DataSeries();
ds.setData(7.0, 6.9, 9.5, 14.5);
ds.setColorAxis(3);
PlotOptionsLine plotOptions = new PlotOptionsLine();
plotOptions.setColor(SolidColor.BLACK); // Line color
Marker marker = new Marker();
marker.setFillColor(SolidColor.YELLOW); // Point inside color
marker.setLineWidth(2);
marker.setLineColor(SolidColor.PURPLE); // Point outline color
plotOptions.setMarker(marker);
ds.setPlotOptions(plotOptions);
configuration.addSeries(ds);
configuration.getxAxis().setCategories("Jan", "Feb", "Mar", "Apr");
configuration.getxAxis().getLabels().getStyle().setColor(SolidColor.BLUE); // X axis labels color
add(chart);
}
}
CSS Styling
Styling Charts with CSS works similarly to other Vaadin components: create a vaadin-chart.css file in your theme’s components folder, and place the styles there.
It’s also possible to use the @CssImport annotation to load the style sheet in Flow applications.
See Highcharts styling documentation for details on CSS styling of Charts.
CSS Styling Mode for Flow
Flow applications can use CSS styling by enabling "styled mode" in the Chart configuration:
Source code
Java
Chart chart = new Chart();
Configuration conf = chart.getConfiguration();
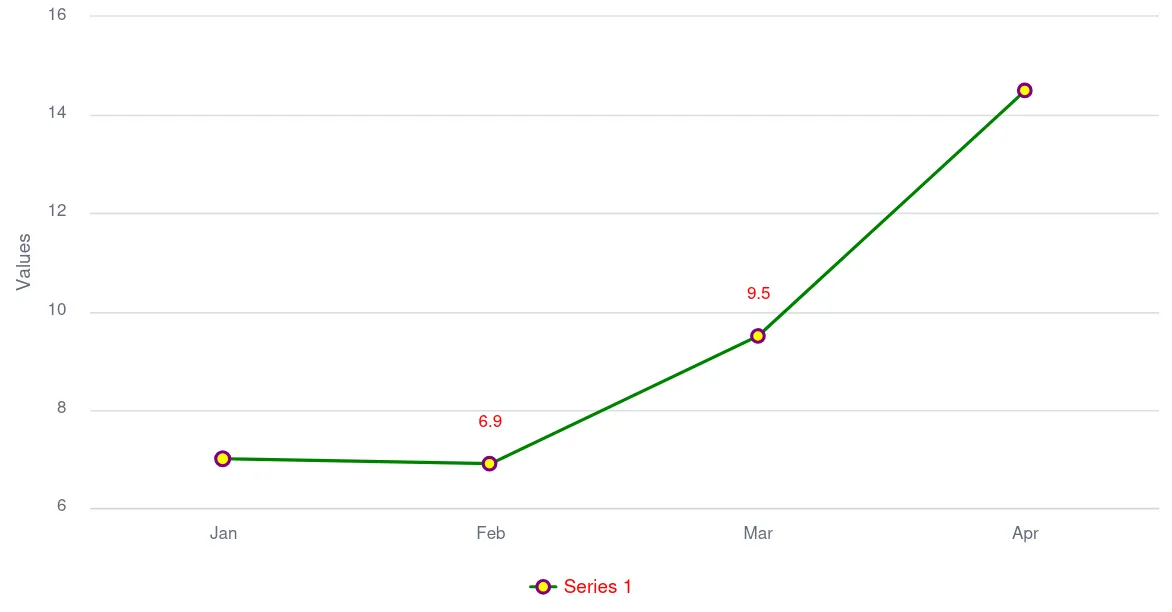
conf.getChart().setStyledMode(true);CSS Styling Example
In this example CSS is used to change the color of point markers to yellow, their outline to purple, data labels to red, and line colors to green.
Source code
themes/{mytheme}/components/vaadin-chart.css
themes/{mytheme}/components/vaadin-chart.css:host(.first-chart) .highcharts-color-0 .highcharts-point {
fill: yellow;
stroke: purple;
stroke-width: 2px;
}Source code
themes/{mytheme}/styles.css
themes/{mytheme}/styles.cssvaadin-chart.first-chart {
--vaadin-charts-color-0: green;
--vaadin-charts-color-1: lightgreen;
--vaadin-charts-color-2: darkgreen;
--vaadin-charts-data-label: red;
}Source code
CssStyleExample.java
CssStyleExample.javapublic class CssStyleExample extends Div {
public CssStyleExample() {
Chart chart = new Chart();
Configuration configuration = chart.getConfiguration();
ChartModel chartModel = configuration.getChart();
chartModel.setType(ChartType.LINE);
chartModel.setStyledMode(true);
configuration.getxAxis().setCategories("Jan", "Feb", "Mar", "Apr");
DataSeries ds = new DataSeries();
ds.setData(7.0, 6.9, 9.5, 14.5);
DataLabels callout = new DataLabels(true);
callout.setShape(Shape.CALLOUT);
callout.setY(-12);
ds.get(1).setDataLabels(callout);
ds.get(2).setDataLabels(callout);
configuration.addSeries(ds);
chart.addClassName("first-chart");
add(chart);
}
}
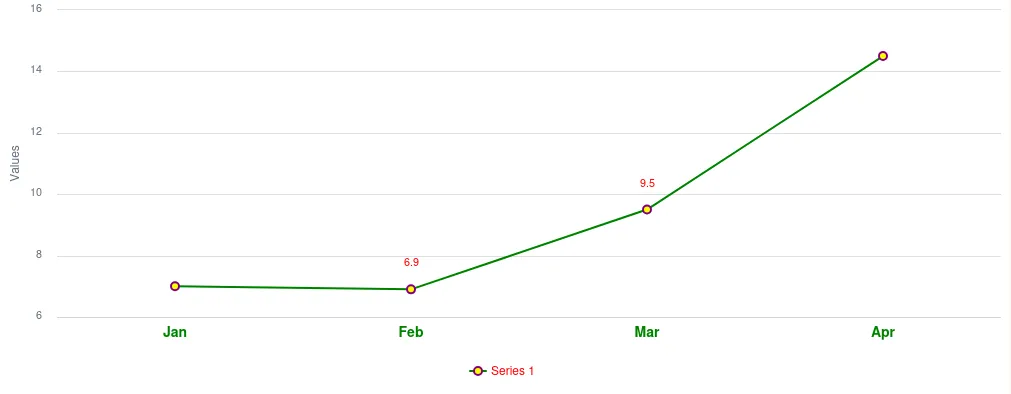
Adding and Styling a Class Name
CSS class names can be applied to both chart instances and individual chart elements.
In the example below, the bold-green-axis class name is applied to the X-axis of a chart to give it a distinct style.
Source code
CssStyleExample.java
CssStyleExample.javaconfiguration.getxAxis().setClassName("bold-green-axis");Source code
themes/{mytheme}/components/vaadin-chart.css
themes/{mytheme}/components/vaadin-chart.css.bold-green-axis {
font-weight: bold;
fill: green;
font-size: 14px;
}
3E5B31FB-DF25-4D1E-80EB-7AB485C7B566