Run in IntelliJ IDEA
You can run and debug your Vaadin application in IntelliJ IDEA as you would any other Java application. When you imported the project into IntelliJ IDEA, a run/debug configuration called Application should have been created automatically. You can start the application by clicking the Debug button in the toolbar. It is indicated by a red circle in this screenshot:
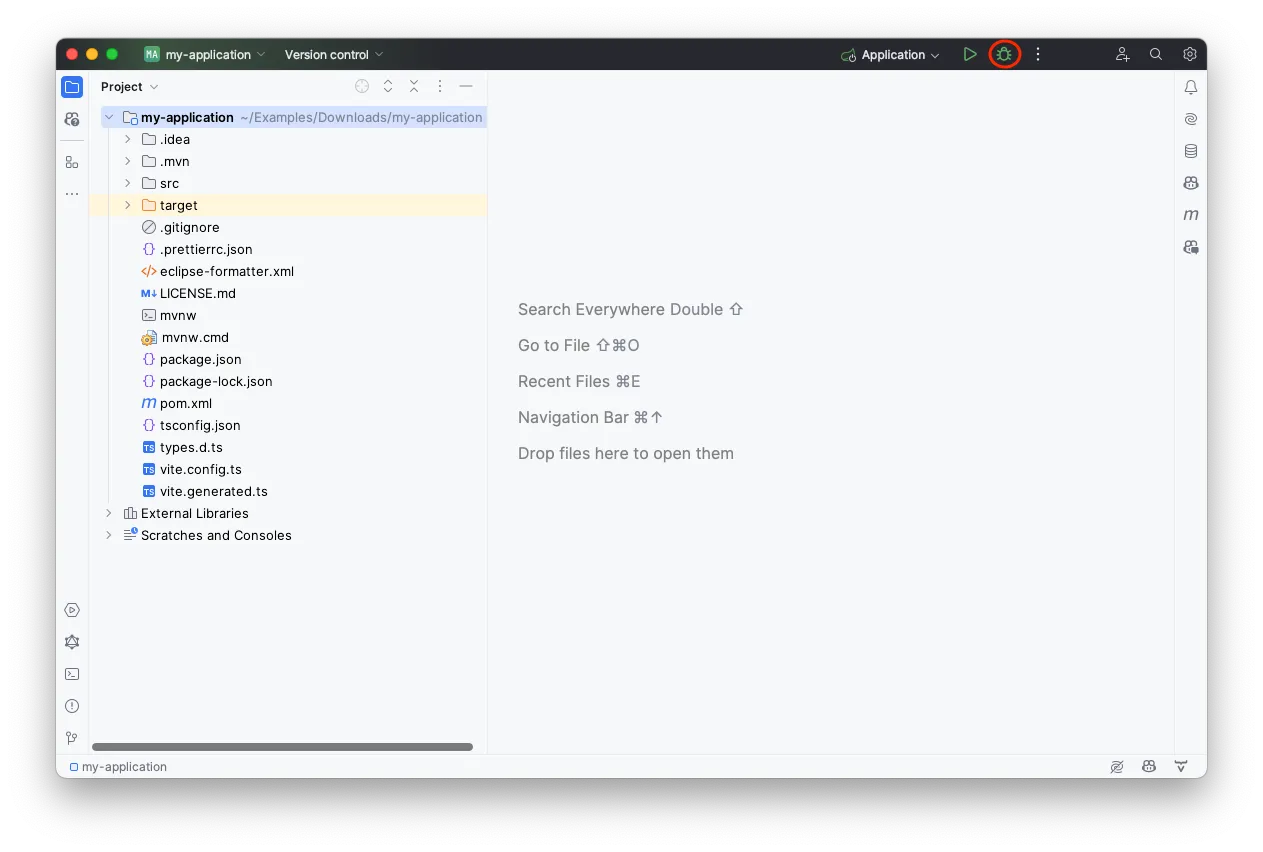
The application starts up and you can access it at http://localhost:8080. Hot deploy of the frontend files is enabled automatically. However, to enable Java hotswap, you have to take some additional actions.
Gradle Projects
By default, IntelliJ IDEA delegates build and run actions to Gradle for Gradle-based projects. For a better development experience, configure IntelliJ IDEA to build and run using its own compiler instead:
-
Go to Settings > Build, Execution, Deployment > Build Tools > Gradle.
-
Under Build and run using, select IntelliJ IDEA.
-
Under Run tests using, select IntelliJ IDEA.
This avoids unnecessary Gradle task execution during development and provides faster compilation.
|
Tip
|
When using hot deploy with Gradle, ensure that |
Enabling Hotswap
The easiest way of running a Vaadin application with hotswap in IntelliJ IDEA is by installing the Vaadin plugin. If you haven’t done so already, do it now.
Click on the button with three small dots next to the run/debug configuration. It is highlighted on this screenshot with a red circle:
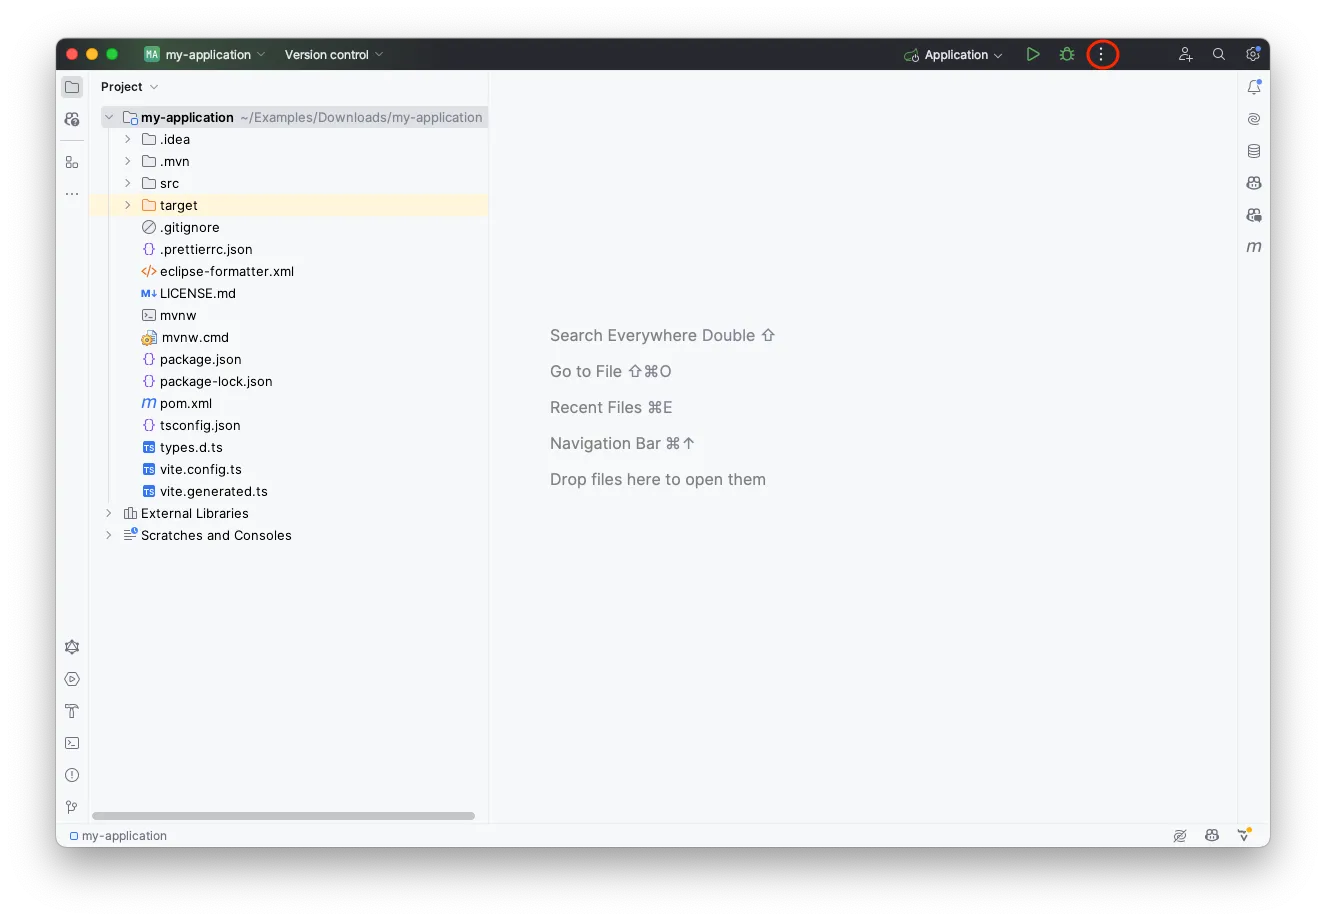
This brings up a menu that looks like this:
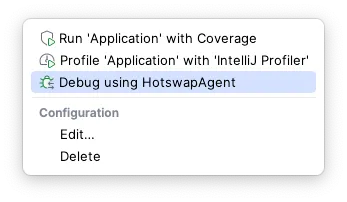
Start the application by selecting Debug using HotswapAgent. If you can’t see this option, the Vaadin plugin has not been installed correctly.
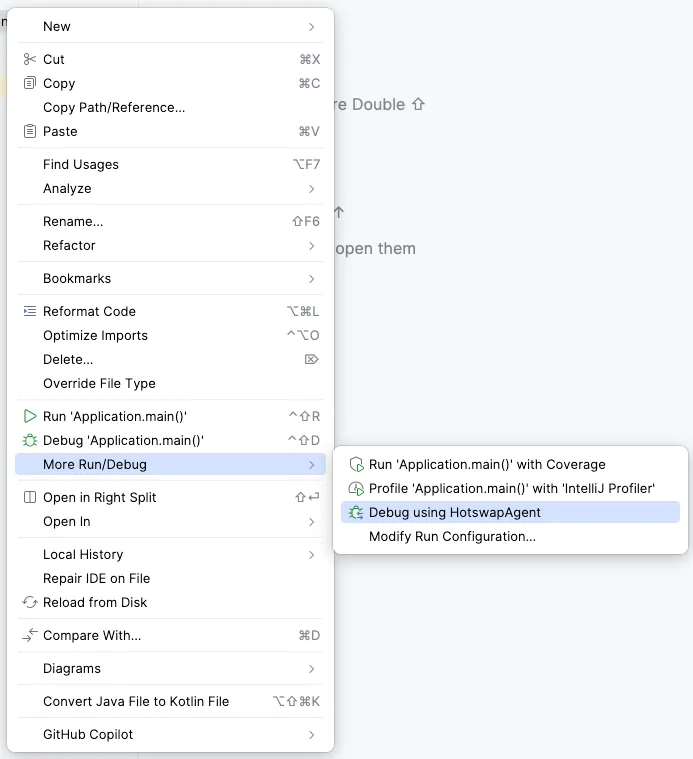
If the run/debug configuration was not automatically created, you can start the application in another way. Look up the main application class and right-click it in the project navigator. Then click , as shown on this screenshot:
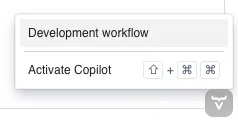
Your application now starts up with hotswap of Java classes enabled. Open the application in a browser and verify that everything is working through Vaadin Copilot. Move your mouse pointer over the Copilot button at the bottom-right corner:
|
Important
| The Copilot button is only available when the application is running in development mode. It is not available in production mode. |
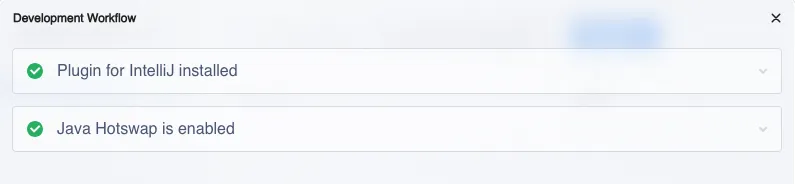
Now click Development workflow. You can see that both the IntelliJ IDEA plugin and hotswap are working correctly: