Run in Eclipse IDE
You can run and debug your Vaadin application in Eclipse IDE as you would any other Java application. Open the main Application class. Then click the Debug button in the toolbar indicated by a red circle in this screenshot:
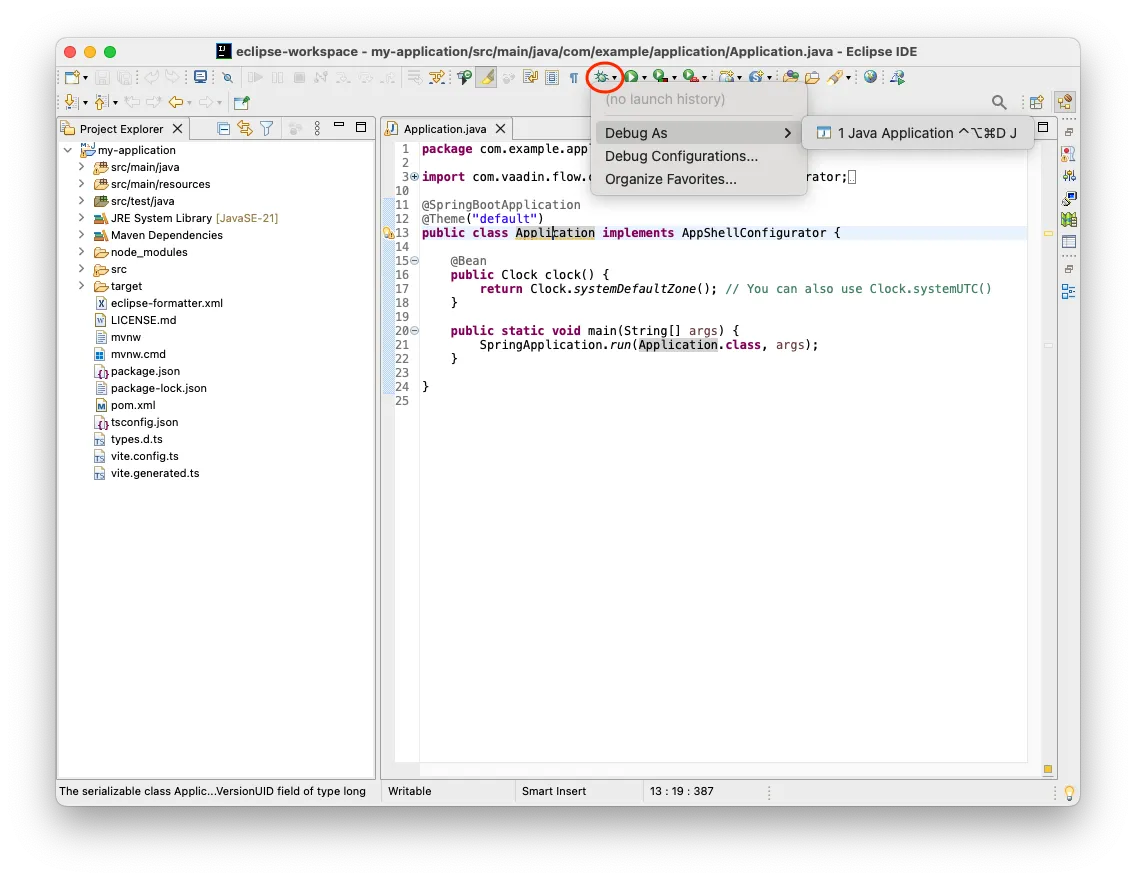
Now click . The application starts up and you can access it at http://localhost:8080. Hot deploy of the frontend files is enabled automatically. However, to enable Java hotswap, you have to take some additional actions.
Enabling Hotswap
Enabling hotswap manually consists of three steps:
-
Download and install JetBrains Runtime;
-
Download HotswapAgent and install it into JetBrains Runtime; and
-
Create a debug configuration for Eclipse IDE that runs the application with JetBrain Runtime and additional JVM parameters.
JetBrains Runtime
You can download the latest version from the JetBrains GitHub release page. Be sure to select the correct architecture. Use JetBrains Runtime to execute your application, not necessarily your IDE.
HotswapAgent
You can download HotswapAgent from the HotswapAgent GitHub release page. You’ll need version 1.4.2 or later.
Download the JAR file and place it inside the JetBrains Runtime installation directory as lib/hotswap/hotswap-agent.jar. You’ll need to create the hotswap folder, and rename the downloaded file to hotswap-agent.jar.
If you want to know more about the features of HotswapAgent, the documentation in the HotswapAgent webpage is a good resource.
Debug Configuration
Select , indicated by a red rectangle on this screenshot:
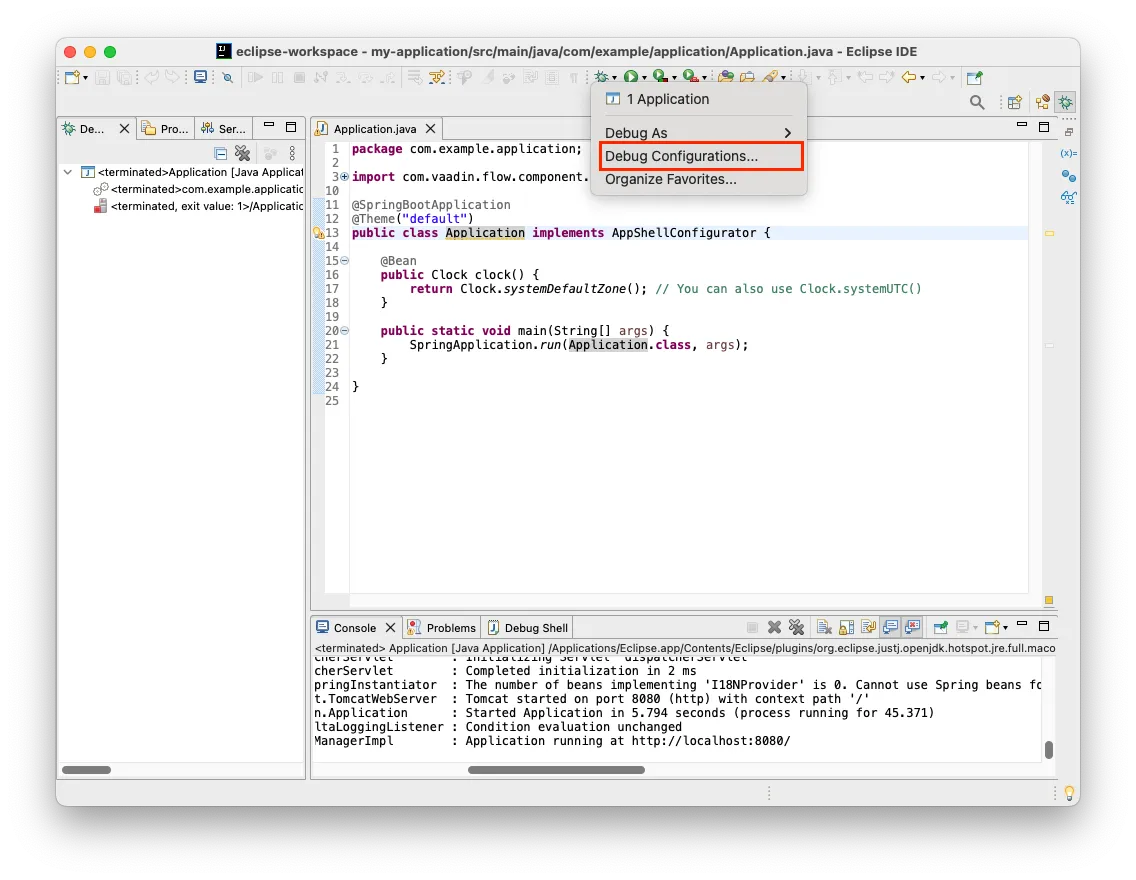
In the Debug Configurations window, select the Application configuration. Go to the Arguments tab. In the VM arguments field, copy-paste the following:
Source code
-XX:+AllowEnhancedClassRedefinition -XX:+ClassUnloading -XX:HotswapAgent=fatjar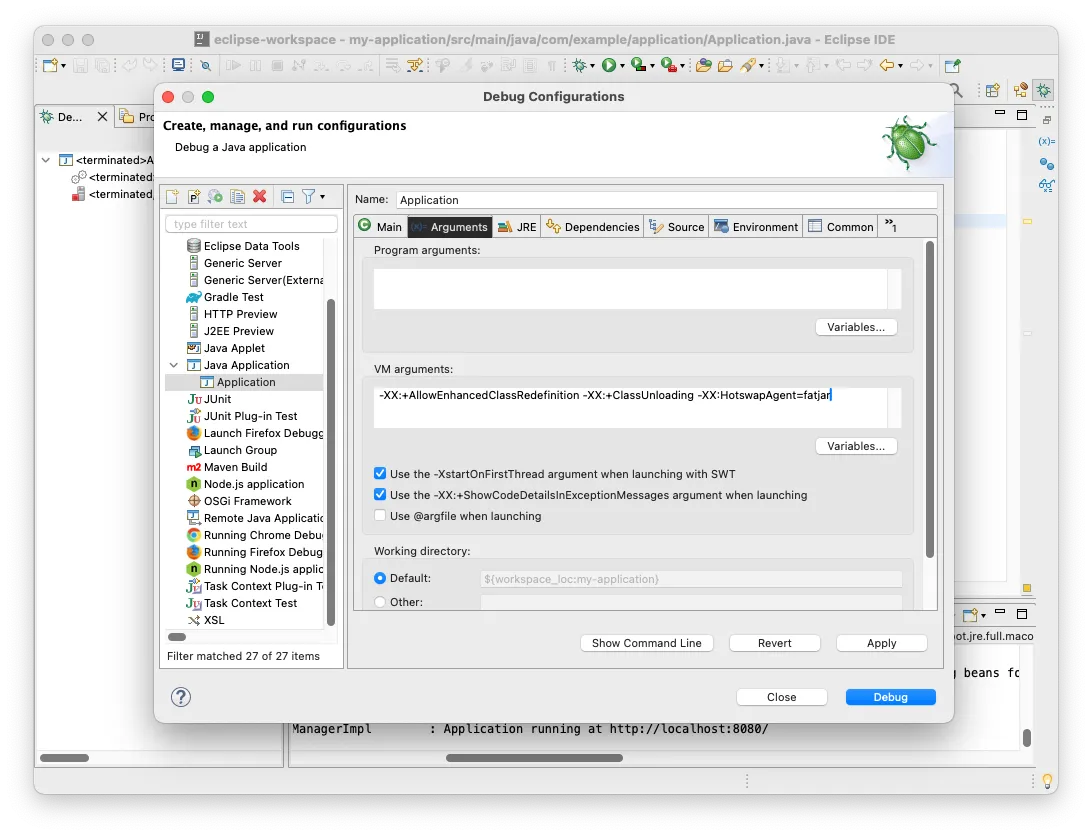
Next, go to the JRE tab. From the Alternate JRE select box, select JetBrains Runtime. If you can’t find it in the list, click Installed JREs and add it manually.
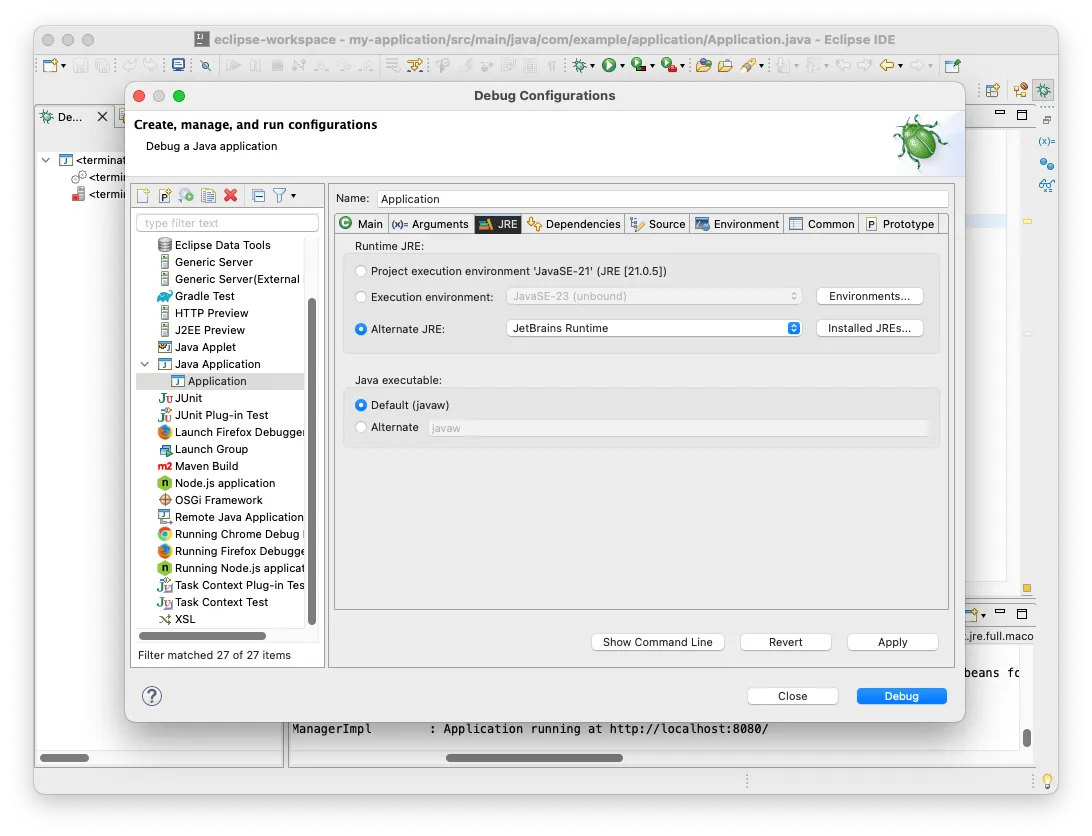
Click Apply, then start the application by clicking Debug. The application starts up.
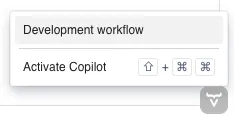
Open the application in a browser and verify that everything is working through Vaadin Copilot. Move your mouse pointer over the Copilot button at the bottom-right corner:
|
Important
| The Copilot button is only available when the application is running in development mode. It is not available in production mode. |
Now click Development workflow. Your browser should look something like this:
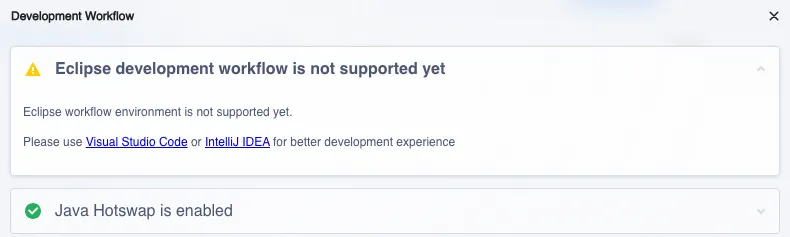
The first item is orange because Vaadin does not have an official plugin for Eclipse IDE. However, Java hotswap is enabled.