Scalable web applications
Introduction
Whether you are creating a new web application or maintaining an existing one, one thing you certainly will consider is the scalability of your web application. Scalability is your web application’s ability to handle a growing number of concurrent users. How many concurrent users can, for instance, your system serve at its peak usage? Will it be intended for a small scale intranet usage of tens to hundreds of concurrent users, or do you plan to reach for a medium size global web application such as 500px.com with about 1000-3000 concurrent users. Or is your target even higher? You might wonder how many concurrent users there are in Facebook or Linkedin. We wonder about that too, and thus made a small study to estimate it. You can see the results in Figure 1 below. The estimates are derived from monthly visitors and the average visit time data found from Alexa.com.
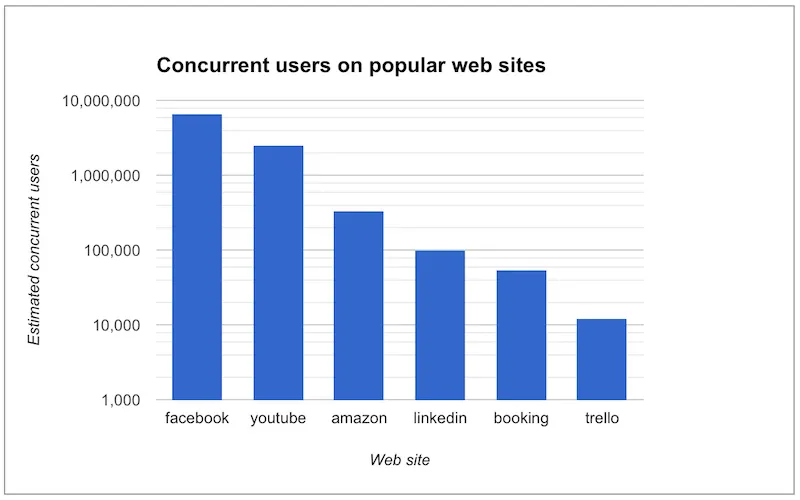
Figure 1: Popular web applications with estimated number of concurrent users.
The purpose of this article is to show you common pain points which tend to decrease the scalability of your web applications and help you find out ways to overcome those. We begin by introducing you to our example application. We will show you how to test the scalability of this example application with Gatling, a tool for stress testing your web application. Then, in the next chapters, we will go through some pain points of scalability, such as memory, CPU, and database, and see how to overcome these.
Book store inventory application
Throughout this example we’ll use a book store inventory application
(see Figure 2) as an example application when deep diving into the world
of web application scalability. The application contains a login view
and an inventory view with CRUD operations to a mockup data source. It
also has the following common web application features: responsive
layouts, navigation, data listing and master detail form editor. This
application is publicly available as a Maven archetype
(vaadin-archetype-application-example). We will first test how many
concurrent users the application can serve on a single server.

Figure 2: Book store inventory application
The purpose of scalability testing is to verify whether the application’s server side can survive with a predefined number of concurrent users or not. We can utilize a scalability test to find the limits, a breaking point or server side bottlenecks of the application. There are several options for scalability testing web applications. One of the most used free tools is Apache JMeter. JMeter suits well for testing web applications, as long as the client-server communication does not use websockets. When using asynchronous websocket communication, one can use the free Gatling tool or the commercial NeoLoad tool.
You can find a lot of step by step tutorials online on how to use Gatling and JMeter. There is typically a set of tips and tricks that one should take into account when doing load testing on certain web frameworks, such as the open source Vaadin Framework. For more information on Vaadin specific tutorials, check the wiki pages on vaadin.com/scalability.
Gatling and JMeter can be used to record client to server requests of a web application. After recording, the recorded requests can be played back by numbers of concurrent threads. The more threads (virtual users) you use the higher the simulated load generated on the tested application.
Since we want to test our application both in synchronous and asynchronous communication modes, we will use Gatling. Another benefit of Gatling compared to JMeter is that it is less heavy for a testing server, thus more virtual users can be simulated on a single testing server. Figure 3 shows the Gatling settings used to record the example scenario of the inventory application. Typically all static resources are excluded from the recording (see left bottom corner of the figure), since these are typically served from a separate http server such as Nginx or from a CDN (Content Delivery Network) service. In our first test, however, we still recorded these requests to see the worst case situation, where all requests are served from a single application server.
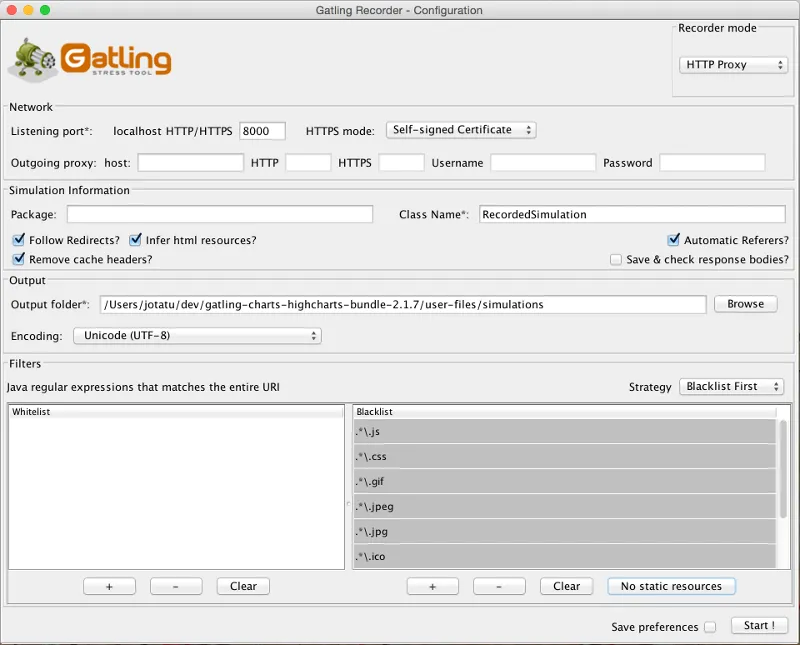
Figure 3: Gatling recorder.
Gatling gathers the recorded requests as text files and composes a Scala class which is used to playback the recorded test scenario. We planned a test scenario for a typical inventory application user: The user logs in and performs several updates (in our case 11) to the store in a relatively short time span (3 minutes). We also assumed that they leave the inventory application open in their browser which will result in the HttpSession not closing before a session timeout (30min in our case).
Let’s assume that we have an extremely large bookstore with several persons (say 10000) responsible for updating the inventory. If one person updates the inventory 5 times a day, and an update session takes 3 minutes, then with the same logic as we calculated concurrent users in the Introduction, we will get a continuous load of about 100 concurrent users. This is of course not a realistic assumption unless the application is a global service or it is a round-the-clock used local application, such as a patient information system. For testing purposes this is, however, a good assumption.
A snippet from the end of our test scenario is shown in Figure 4. This test scenario is configured to be run with 100 concurrent users, all started within 60 seconds (see the last line of code).
Source code
scala
.pause(9)
.exec(http(>"request_45")
    .post(>"/test/UIDL/?v-uiId=0")
    .headers(headers_9)
    .body(RawFileBody(>"RecordedSimulation_0045_request.txt")))
.pause(5)
.exec(http(>"request_46")
    .post(>"/test/UIDL/?v-uiId=0")
    .headers(headers_9)
    .body(RawFileBody(>"RecordedSimulation_0046_request.txt"))
    .resources(http(>"request_47")
    .post(uri1 + >"/UIDL/?v-uiId=0")
    .headers(headers_9)
    .body(RawFileBody(>"RecordedSimulation_0047_request.txt"))))}
setUp(scn.inject(rampUsers(100) over (60 seconds))).protocols(httpProtocol)
Figure 4: Part of the test scenario of inventory application.
To make the test more realistic, we would like to execute it several times. Without repeating we do not get a clear picture of how the server will tolerate a continuous high load. In a Gatling test script, this is achieved by wrapping the test scenario into a repeat loop. We should also flush session cookies to ensure that a new session is created for each repeat. See the second line of code in Figure 5, for an example of how this could be done.
Source code
scala
val scn = scenario("RecordedSimulation")
    .repeat(100,"n"){exec(flushSessionCookies).exec(http("request_0")
    .get("/test/")
        .resources(http("request_1")
        .post(uri1 + "/?v-1440411375172")
        .headers(headers_4)
        .formParam("v-browserDetails", "1")
        .formParam("theme", "mytheme")
        .formParam("v-appId", "test-3556498")
Figure 5: Repeating 100 times with session cookie flushing (small part of whole script)
We tested how well this simple example application tolerated several concurrent users. We deployed our application in Apache Tomcat 8.0.22 on a Windows 10 machine with Java 1.7.0 and an older quad core mobile Intel i7 processor. With its default settings (using the default heap size of 2GB), Tomcat was able to handle about 200 concurrent users for a longer time. The CPU usage for that small number of concurrent users was not a problem (it was lower than 5%), but the server configurations were a bottleneck. Here we stumbled upon the first scalability pain point: server configuration issues (see next chapter). It might sound surprising that we could only run a such small number of concurrent users by default, but do not worry, we are not stuck here. We will see the reasons for this and other scalability pain points in the following chapter.
Scalability pain points
We will go through typical pain points of a web application developer which she (or he) will encounter when developing a web application for hundreds of concurrent users. Each pain point is introduced in its own subchapter and followed by typical remedies.
Server configuration issues
One typical problem that appears when there are lots of concurrent
users, is that the operating system (especially the *nix based ones) run
out of file descriptors. This happens since most *nix systems have a
pretty low default limit for the maximum number of open files, such as
network connections. This is usually easy to fix with the ulimit
command though sometimes it might require configuring the sysctl too.
A little bit unexpected issues can also surface with network bandwidth. Our test laptop was on a wireless connection and its sending bandwidth started choking at about 300 concurrent users. (Please note that we use an oldish laptop in this entire test to showcase the real scalability of web apps –your own server environment will no doubt be even more scalable even out of the box.) One part of this issue was the wifi and another part was that we served the static resources, such as javascript files, images and stylesheets, from Tomcat. At this point we stripped the static resources requests out of our test script to simulate the situation where those are served from a separate http server, such as nginx. Please read the blog post “https://vaadin.com/blog/-/blogs/optimizing-hosting-setup[Optimizing hosting setup]” from our website for more information about the topic.
Another quite typical configuration issue is that the application server is not configured for a large number of concurrent users. In our example, a symptom of this was that the server started rejecting (“Request timed out”) new connections after a while, even though there were lots of free memory and CPU resources available.
After we configured our Apache Tomcat for high concurrent mode and removed static resource requests, and connected the test laptop into a wired network, we were able to push the number of concurrent users from 200 up to about 500 users. Our configuration changes into the server.xml of Tomcat are shown in Figure 6, where we define a maximum thread count (10240), an accepted threads count (4096), and a maximum number of concurrent connections (4096).
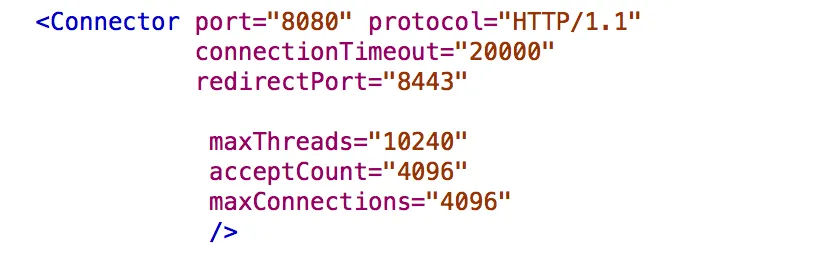
Figure 6: Configuring Tomcat’s default connector to accept a lot of concurrent users.
The next pain point that appeared with more than 500 users was that we were out of memory. The default heap size of 2GB eventually ran out with such high number of concurrent users. On the other hand, there was still a lot of CPU capacity available, since the average load was less than 5%.
Out of memory
Insufficient memory is possibly the most common problem that limits the
scalability of a web application with a state. An http session is used
typically to store the state of a web application for its user. In
Vaadin an http session is wrapped into a VaadinSession. A
VaadinSession contains the state (value) of each component (such as
Grid, TextFields etc.) of the user interface. Thus,
straightforwardly the more components and views you have in your Vaadin
web application, the bigger is the size of your session.
In our inventory application, each session takes about 0.3MB of memory which is kept in memory until the session finally closes and the garbage collectors free the resources. The session size in our example is a little bit high. With constant load of 100 concurrent users, a session timeout of 30 minutes and an average 3 minutes usage time, the expected memory usage is about 350MB. To see how the session size and the number of concurrent users affect the needed memory in our case, we made a simple analysis which results are shown in Figure 7. We basically calculated how many sessions there can exist at most, by calculating how many users there will be within an average usage time plus the session timeout.
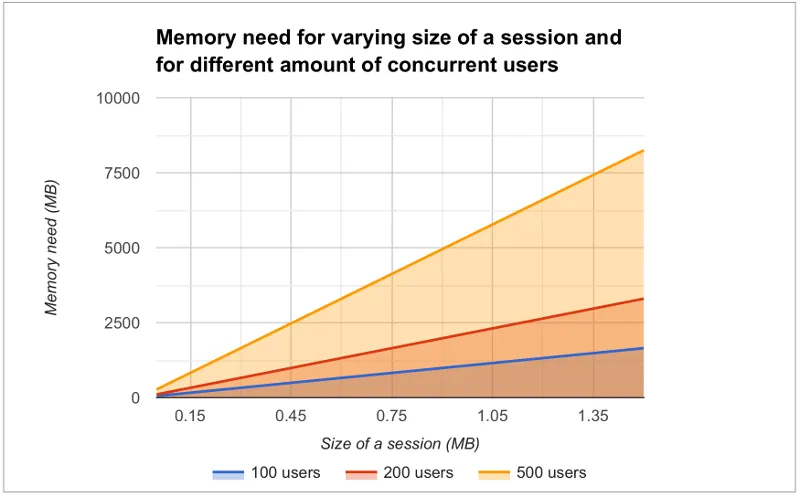
Figure 7: Memory need for varying size sessions and a different number of concurrent users.
Remedies
Use more memory
This might sound simplistic, but many times it might be enough to just add as much memory as possible to the server. Modern servers and server operating systems have support for hundreds of gigabytes of physical memory. For instance, again in our example, if the size of a session would be 0.5MB and we had 5000 concurrent users, the memory need would be about 28GB.
You also have to take care that your application server is configured to
reserve enough memory. For example, the default heap size for Java is
typically 2GB and for example Apache Tomcat will not reserve more memory
if you do not ask it to do it with -Xmx JVM argument. You might
need a special JVM for extremely large heap sizes. We used the following
Java virtual machine parameters in our tests:
-Xms5g -Xmx5g -Xss512k -server
The parameters -Xms and -Xmx are for setting the minimum and
the maximum heap size for the server (5 GB in the example), the -Xss
is used to reduce the stack size of threads to save memory (typically
the default is 1MB for 64bit Java) and the -server option tells JVM
that the Java process is a server.
Minimize the size of a session
The biggest culprit for the big session size in the inventory application is the container (BeanItemContainer) which is filled with all items of the database. Containers, and especially the built in fully featured BeanItemContainer, are typically the most memory hungry parts of Vaadin applications. One can either reduce the number of items loaded in the container at one time or use some lightweight alternatives available from Vaadin Directory (vaadin.com/directory) such as Viritin, MCont, or GlazedLists Vaadin Container. Another approach is to release containers and views to the garbage collection e.g. every time the user switches into another view, though that will slightly increase the CPU load since the views and containers have to be rebuilt again, if the user returns to the view. The feasibility of this option is up to your application design and user flow –usually it’s a good choice.
Use a shorter session time out
Since every session in the memory reserves it for as long as it stays there, the shorter the session timeout is, the quicker the memory is freed. Assuming that the average usage time is much shorter than the session timeout, we can state that halving the session timeout approximately halves the memory need, too. Another way to reduce the session’s time in the memory could be instructing users to logout after they are done.
The session of a Vaadin application is kept alive by requests (such as
user interactions) made from the client to the server. Besides user
interaction, the client side of Vaadin application sends a heartbeat
request into the server side, which should keep the session alive as
long as the browser window is open. To override this behaviour and to
allow closing idle sessions, we recommend that the closeIdleSessions
parameter is used in your servlet configuration. For more details, see
chapter
Application
Lifecycle in the Book of Vaadin.
Use clustering
If there is not enough memory, for example if there is no way to reduce the size of a session and the application needs a very long session timeout, then there is only one option left: clustering. We will discuss clustering later in the Out of CPU chapter since clustering is more often needed for increasing CPU power.
Out of CPU
We were able to get past the previous limit of 500 concurrent users by increasing the heap size of Tomcat to 5GB and reducing the session timeout to 10 minutes. Following the memory calculations above, we should theoretically be able to serve almost 3000 concurrent users with our single server, if there is enough CPU available.
Although the average CPU load was rather low (about 10%) still with 800 concurrent users, it jumped up to 40% every now and then for several seconds as the garbage collector cleaned up unused sessions etc. That is also the reason why one should not plan to use full CPU capacity of a server since that will increase the garbage collection time in worst case even to tens of seconds, while the server will be completely unresponsive for that time. We suggest that if the average load grows to over 50% of the server’s capacity, other means have to be taken into use to decrease the load of the single server.
We gradually increased the number of concurrent users to find out the limits of our test laptop and Tomcat. After trial and error, we found that the safe number of concurrent users for our test laptop was about 1700. Above that, several request timeout events occurred even though the CPU usage was about 40-50% of total capacity. We expect that using a more powerful server, we could have reached 2000-3000 concurrent users quite easily.
Remedies
Analyze and optimize performance bottlenecks
If you are not absolutely sure about the origin of the high CPU usage, it is always good to verify it with a performance profiling tool. There are several options for profiling, such as JProfiler, XRebel, and Java VisualVM. We will use VisualVM in this case since it comes freely with every (Oracle’s) JDK since the version 1.5.
Our typical procedure goes like this: 1. Deploy your webapp and start
your server, 2. Start VisualVM and double click your server’s process
(“e.g. Tomcat (pid 1234)”) on the Applications tab (see Figure 8), 3.
Start your load test script with, for instance, 100 concurrent users, 4.
Open the Sampler tab to see where the CPU time is spent, 5. Use the
filter on the bottom to show the CPU usage of your application (e.g.
“biz.mydomain.projectx”) and possible ORM (Object-relational mapping)
framework (e.g. “org.hibernate”) separately.
Typically, only a small part (e.g. 0.1 - 2 %) of CPU time is spent on
the classes of your webapp, if your application does not contain heavy
business logic. Also, CPU time spent on the classes of Vaadin should be
very small (e.g. 1%). You can be relaxed about performance bottlenecks
of your code if the most time (>90%) is spent on application server’s
classes (e.g. �“org.apache.tomcat”).
Unfortunately, quite often database functions and ORM frameworks take a pretty big part of CPU time. We will discuss how to tackle heavy database operations in the Database chapter below.
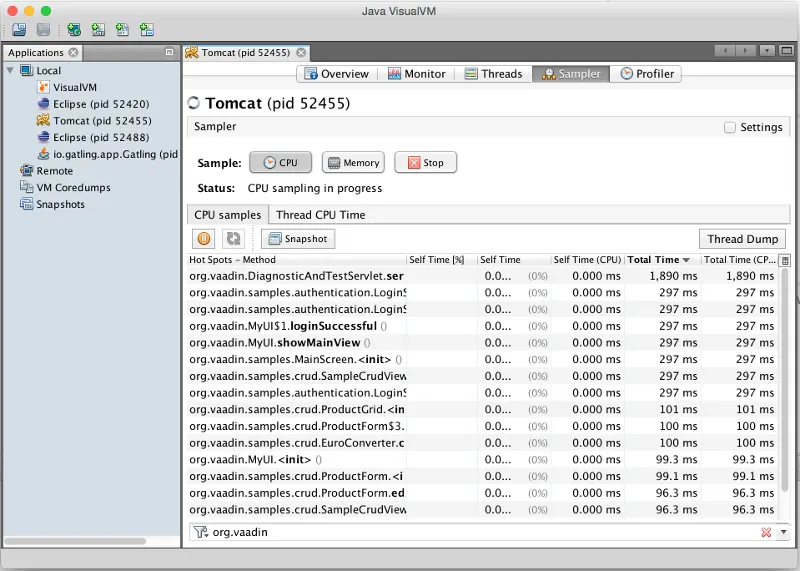
Figure 8: Profiling CPU usage of our inventory application with Java VisualVM
Use native application server libraries
Some application servers (at least Tomcat and Wildfly) allow you to use native (operating system specific) implementation of certain libraries. For example, The Apache Tomcat Native Library gives Tomcat access to certain native resources for performance and compatibility. Here we didn’t test the effect of using native libraries instead of standard ones. With little online research, it seems that the performance benefit of native libraries for Tomcat is visible only if using secured https connections.
Fine tune Java garbage collection
We recommended above not to strain a server more than 50% of its total CPU capacity. The reason was that above that level, a garbage collection pause tends to freeze the server for too long a time. That is because it typically starts not before almost all of the available heap is already spent and then it does the full collection. Fortunately, it is possible to tune the Java garbage collector so that it will do its job in short periods. With little online study, we found the following set of JVM parameters for web server optimized garbage collection
-XX:+UseCMSInitiatingOccupancyOnly
-XX:CMSInitiatingOccupancyFraction=70
The first parameter prevents Java from using its default garbage collection strategy and makes it use CMS (concurrent-mark-sweep) instead. The second parameter tells at which level of “occupancy” the garbage collection should be started. The value 70% for the second parameter is typically a good choice but for optimal performance it should be chosen carefully for each environment e.g. by trial and error.
The CMS collector should be good for heap sizes up to about 4GB. For bigger heaps there is the G1 (Garbage first) collector that was introduced in JDK 7 update 4. G1 collector divides the heap into regions and uses multiple background threads to first scan regions that contain the most of garbage objects. Garbage first collector is enabled with the following JVM parameter.
-XX:+UseG1GC
If you are using Java 8 Update 20 or later, and G1, you can optimize the
heap usage of duplicated Strings (i.e. their internal char[] arrays)
with the following parameter.
-XX:+UseStringDeduplication
Use clustering
We have now arrived at the point where a single server cannot fulfill our scalability needs whatever tricks we have tried. If a single server is not enough for serving all users, obviously we have to distribute them to two or more servers. This is called clustering.
Clustering has more benefits than simply balancing the load between two or more servers. An obvious additional benefit is that we do not have to trust a single server. If one server dies, the user can continue on the other server. In worst case, the user loses her session and has to log in again, but at least she is not left without the service. You probably have heard the term “session replication” before. It means that the user’s session is copied into other servers (at least into one other) of the cluster. Then, if the server currently used by the user goes down, the load balancer sends subsequent requests to another server and the user should not notice anything.
We will not cover session replication in this article since we are mostly interested in increasing the ability to serve more and more concurrent users with our system. We will show two ways to do clustering below, first with Apache WebServer and Tomcats and then with the Wildfly Undertow server.
Clustering with Apache Web Server and Tomcat nodes
Traditionally Java web application clustering is implemented with one Apache Web Server as a load balancer and 2 or more Apache Tomcat servers as nodes. There are a lot of tutorials online, thus we will just give a short summary below.
-
Install Tomcat for each node
-
Configure unique node names with jvmRoute parameter to each Tomcat’s server.xml
-
Install Apache Web Server to load balancer node
-
Edit Apache’s httpd.conf file to include mod_proxy, mod_proxy_ajp, and mod_proxy_balancer
-
Configure balancer members with node addresses and load factors into end of httpd.conf file
-
Restart servers
There are several other options (free and commercial ones) for the load balancer, too. For example, our customers have used at least F5 in several projects.
Clustering with Wildfly Undertow
Using Wildfly Undertow as a load balancer has several advantages over Apache Web Server. First, as Undertow comes with your WildFly server, there is no need to install yet another software for a load balancer. Then, you can configure Undertow with Java (see Figure 8) which minimizes the error prone conf file or xml configurations. Finally, using the same vendor for application servers and for a load balancer reduces the risk of intercompatibility issues. The clustering setup for Wildfly Undertow is presented below. We are using sticky session management to maximize performance.
-
Install Wildfly 9 to all nodes
-
Configure Wildfly’s standalone.xml
-
add
“instance-id=”node-id”parameter undertow subsystem, e.g: `<subsystem xmlns="urn:jboss:domain:undertow:2.0" instance-id="node1"> `(this is needed for the sticky sessions). -
set http port to something else than 8080 in socket-binding-group, e.g:
<socket-binding name="http" port="${jboss.http.port:8081}"/> -
Start your node servers accepting all ip addresses:
./standalone.sh -c standalone.xml -b=0.0.0.0 -
Code your own load balancer (reverse proxy) with Java and Undertow libraries (see Figure 9) and start it as a Java application.
Source code
Java
public static void main(final String[] args) {
  try {
    LoadBalancingProxyClient loadBalancer = new LoadBalancingProxyClient()
      .addHost(new URI("http://192.168.2.86:8081"),"node1")
      .addHost(new URI("http://192.168.2.216:8082"),"node2")
      .setConnectionsPerThread(1000);
    Undertow reverseProxy = Undertow.builder()
      .addHttpListener(8080, "localhost")
      .setIoThreads(8)
      .setHandler(new ProxyHandler(loadBalancer, 30000, ResponseCodeHandler.HANDLE_404))
      .build();
      reverseProxy.start();
  } catch (URISyntaxException e) {
    throw new RuntimeException(e);
  }
}
Figure 9: Simple load balancer with two nodes and sticky sessions.
Database
In most cases, the database is the most common and also the most tricky to optimize. Typically you’ll have to think about your database usage before you actually need to start optimizing the memory and CPU as shown above. We assume here that you use object to relational mapping frameworks such as Hibernate or Eclipselink. These frameworks implement several optimization techniques within, which are not discussed here, although you might need those if you are using plain old JDBC.
Typically profiling tools are needed to investigate how much the database is limiting the scalability of your application, but as a rule of thumb: the more you can avoid accessing the database, the less it limits the scalability. Consequently, you should generally cache static (or rarely changing) database content.
Remedies
Analyze and optimize performance bottlenecks
We already discussed shortly, how to use Java VisualVM for finding CPU
bottlenecks. These same instructions also apply for finding out at what
level the database consumes the performance. Typically you have several
Repository-classes (e.g. CustomerRepository) in your web application,
used for CRUD (create, read, update, delete) operations (e.g.
createCustomer). Commonly your repository implementations either
extend Spring’s JPARepository or use javax.persistence.EntityManager
or Spring’s Datasource for the database access. Thus, when profiling,
you will probably see one or more of those database access methods in
the list of methods that are using most of your CPU’s capacity.
According to our experience, one of the bottlenecks might be that small
database queries (e.g. findTaskForTheDay) are executed repeatedly
instead of doing more in one query (e.g. findTasksForTheWeek). In some
other cases, it might be vice versa: too much information is fetched and
only part of it is used (e.g. findAllTheTasks). A real life example of
the latter happened recently in a customer project, where we were able
to a gain significant performance boost just by using JPA Projections to
leave out unnecessary attributes of an entity (e.g. finding only Task’s
name and id) in a query.
Custom caching and Query optimization
After performance profiling, you have typically identified a few queries that are taking a big part of the total CPU time. A part of those queries might be the ones that are relatively fast as a single query but they are just done hundreds or thousands of times. Another part of problematic queries are those that are heavy as is. Moreover, there is also the N+1 query problem, when, for example, a query for fetching a Task entity results N more queries for fetching one-to-many members (e.g. assignees, subtasks, etc.) of the Task.
The queries of the first type might benefit from combining to bigger
queries as discussed in the previous subchapter (use
findTasksForTheWeek instead of findTaskForTheDay). I call this
approach custom caching. This approach typically requires changes in
your business logic too: you will need to store (cache) yet unneeded
entities, for example in a HashMap or List and then handle all these
entities sequentially.
The queries of the second type are typically harder to optimize.
Typically slow queries can be optimized by adding a certain index or
changing the query logic into a little bit different form. The difficult
part is to figure out what exactly makes the query slow. I recommend
using a logging setting that shows the actual sql query made in your log
file or console (e.g. in Hibernate use show_sql=true). Then you can
take the query and run it against your database and try to vary it and
see how it behaves. You can even use the EXPLAIN keyword to ask MySQL
or PostgreSql (EXPLAIN PLAN FOR in Oracle and SHOWPLAN_XML in SQL
Server) to explain how the query is executed, what indexes are used etc.
The N+1 queries can be detected by analysing the executed sqls in
the log file. The first solution for the issue is redesigning the
problematic query to use appropriate join(s) to make it fetch all the
members in a single sql query. Sometimes, it might be enough to use
FetchType.EAGER instead of LAZY for the problematic cases. Yet
another possibility could be your own custom caching as discussed above.
Second-level cache
According to Oracle’s Java EE Tutorial: a second-level cache is a local store of entities managed by the persistence provider. It is used to improve the application performance. A second-level cache helps to avoid expensive database queries by keeping frequently used entities in the cache. It is especially useful when you update your database only by your persistence provider (Hibernate or Eclipselink), you read the cached entities much more often than you update them, and you have not clustered your database.
There are different second-level cache vendors such as EHCache, OSCache, and SwarmCache for Hibernate. You can find several tutorials for these online. One thing to keep in mind is that the configuration of, for example, EHCache varies whether you use Spring or not. Our experience of the benefits of second-level caches this far is that in real world applications the benefits might be surprisingly low. The benefit gain depends highly on how much your application uses the kind of data from the database that is mostly read-only and rarely updated.
Use clustering
There are two common options for clustering or replication of the database: master-master replication and master-slave replication. In the master-master scheme any node in the cluster can update the database, whereas in the master-slave scheme only the master is updated and the change is distributed to the slave nodes right after that. Most relational database management systems support at least the master-slave replication. For instance, in MySql and PostgreSQL, you can enable it by few configuration changes and by granting the appropriate master rights for replication. You can find several step-by-step tutorials online by searching with e.g. the keywords “postgresql master slave replication”.
NoSQL
When looking back to the first figure (Figure 1) of the article, you might wonder what kind of database solutions the world’s biggest web application’s use? Most of them use some relation database, partly, and have a NoSQL database (such as Cassandra, MongoDB, and Memcached) for some of the functionality. The big benefit of many NoSQL solutions is that they are typically easier to cluster, and thus help one to achieve extremely scalable web applications. The whole topic of using NoSQL is so big that we do not have the possibility to discuss it in this article.
Summary
We started the study by looking at typical applications and estimated their average concurrent user number. We then started with a typical Vaadin web application and looked at what bottlenecks we hit on the way, by using a standard laptop. We discussed different ways of overcoming everything from File Descriptors to Session size minimization, all the way to Garbage collection tweaking and clustering your entire application. At the end of the day, there are several issues that could gap you applications scalability, but as shown in this study, with a few fairly simple steps we can scale the app from 200 concurrent users to 3000 concurrent users. As a standard architectural answer, however: the results in your environment might be different, so use tools discussed in this paper to find your bottlenecks and iron them out.