Debug Mode and Window
- Enabling the Debug Mode
- Opening the Debug Window
- Debug Message Log
- General Information
- Inspecting Component Hierarchy
- Communication Log
- Debug Modes
Vaadin applications can be run in two modes: debug mode and production mode. The debug mode, which is on by default, enables a number of built-in debug features for Vaadin developers:
-
Debug Window
-
Display debug information in the Debug Window and server console
-
On-the-fly compilation of Sass themes
-
Timings of server calls for Vaadin TestBench
It is recommended to always deploy production applications in production mode for security reasons.
Enabling the Debug Mode
The debug mode is enabled and production mode disabled by default in the UI templates created with the Eclipse plugin or the Maven archetypes. Some archetypes have a separate module and profile for producing a production mode application. The debug mode can be enabled by giving a productionMode=false parameter to the Vaadin servlet configuration:
Source code
@VaadinServletConfiguration(
            productionMode = false,
            ui = MyprojectUI.class)
Or with a context parameter in the web.xml deployment descriptor:
Source code
<context-param>
  <description>Vaadin production mode</description>
  <param-name>productionMode</param-name>
  <param-value>false</param-value>
</context-param>
Enabling the production mode disables the debug features, thereby preventing users from easily inspecting the inner workings of the application from the browser.
Opening the Debug Window
Running an application in the debug mode enables the client-side Debug Window in the browser. You can open the Debug Window by adding " ?debug" parameter to the URL of the UI, for example, http://localhost:8080/myapp/?debug. The Debug Window has buttons for controlling the debugging features and a scrollable log of debug messages.
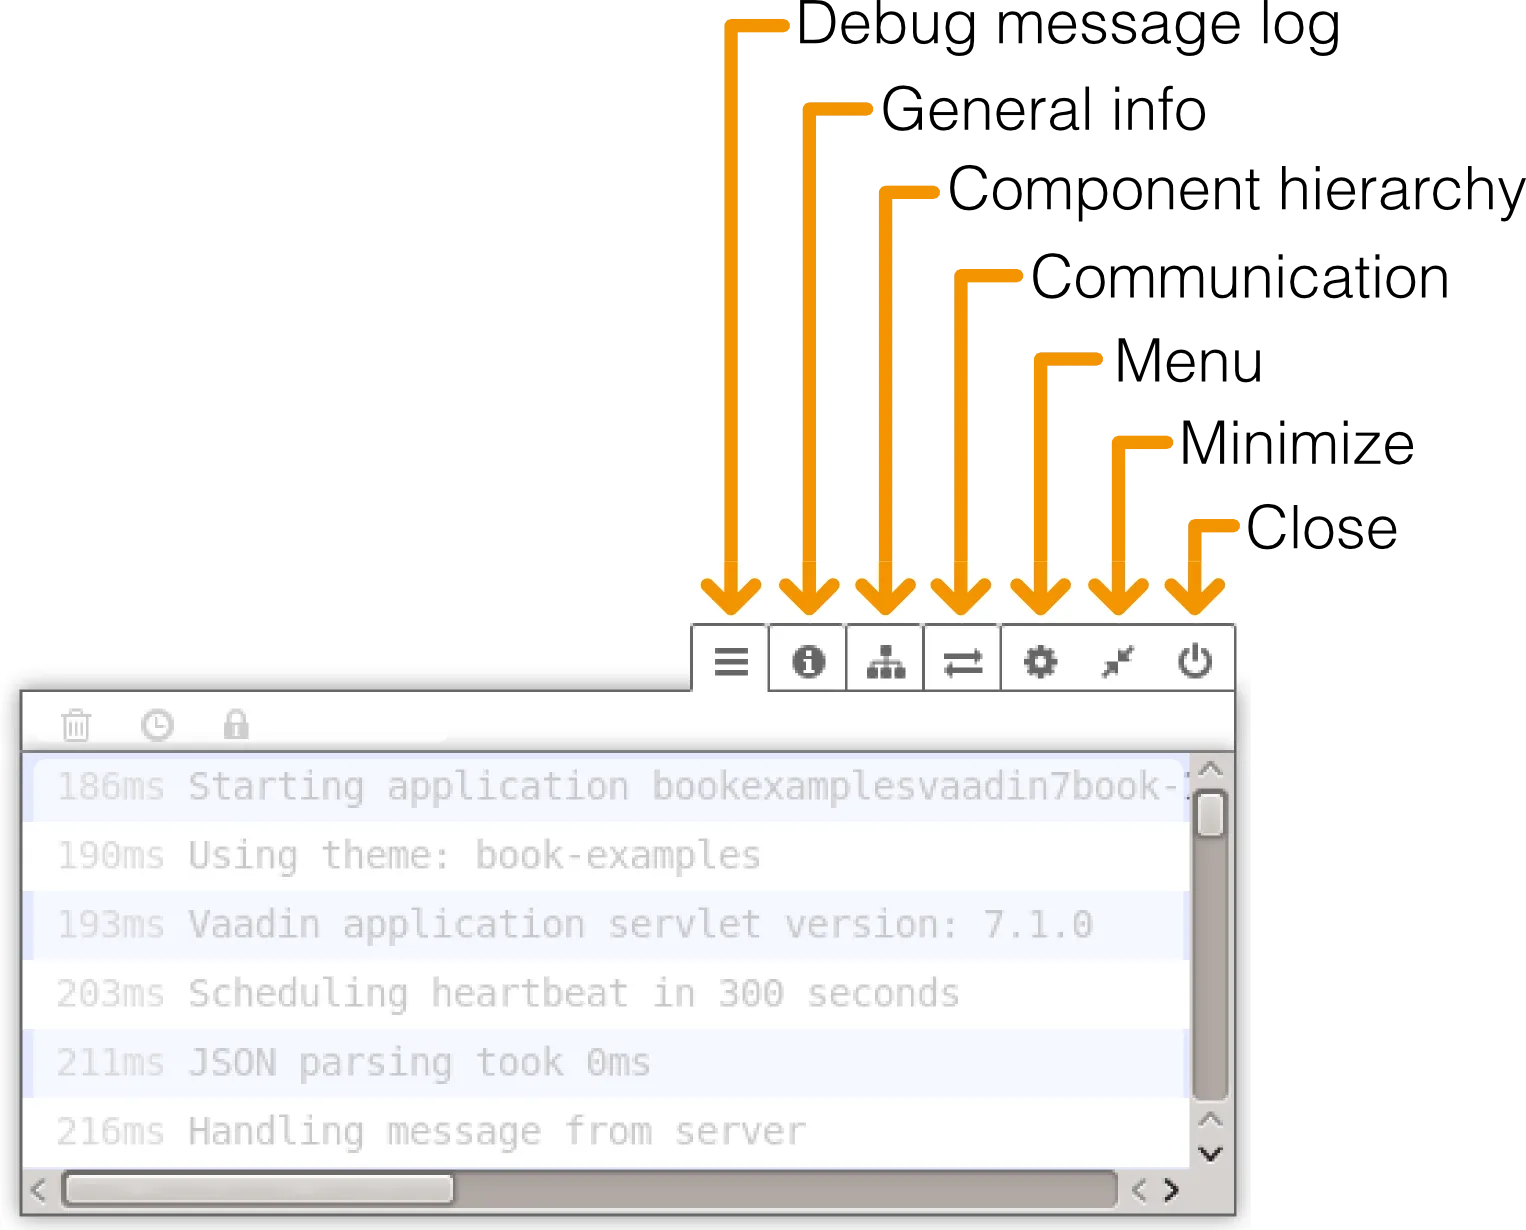
The functionalities are described in detail in the subsequent sections. You can move the window by dragging it from the title bar and resize it from the corners. The button minimizes the debug window in the corner of the browser window, and the button closes it.
If you use the Firebug plugin for Firefox or the Developer Tools console in Chrome, the log messages will also be printed to the inspector console. In such a case, you may want to enable client-side debugging without showing the Debug Window with " ?debug=quiet" in the URL. In the quiet debug mode, log messages will only be printed to the console of the browser debugger.
Debug Message Log
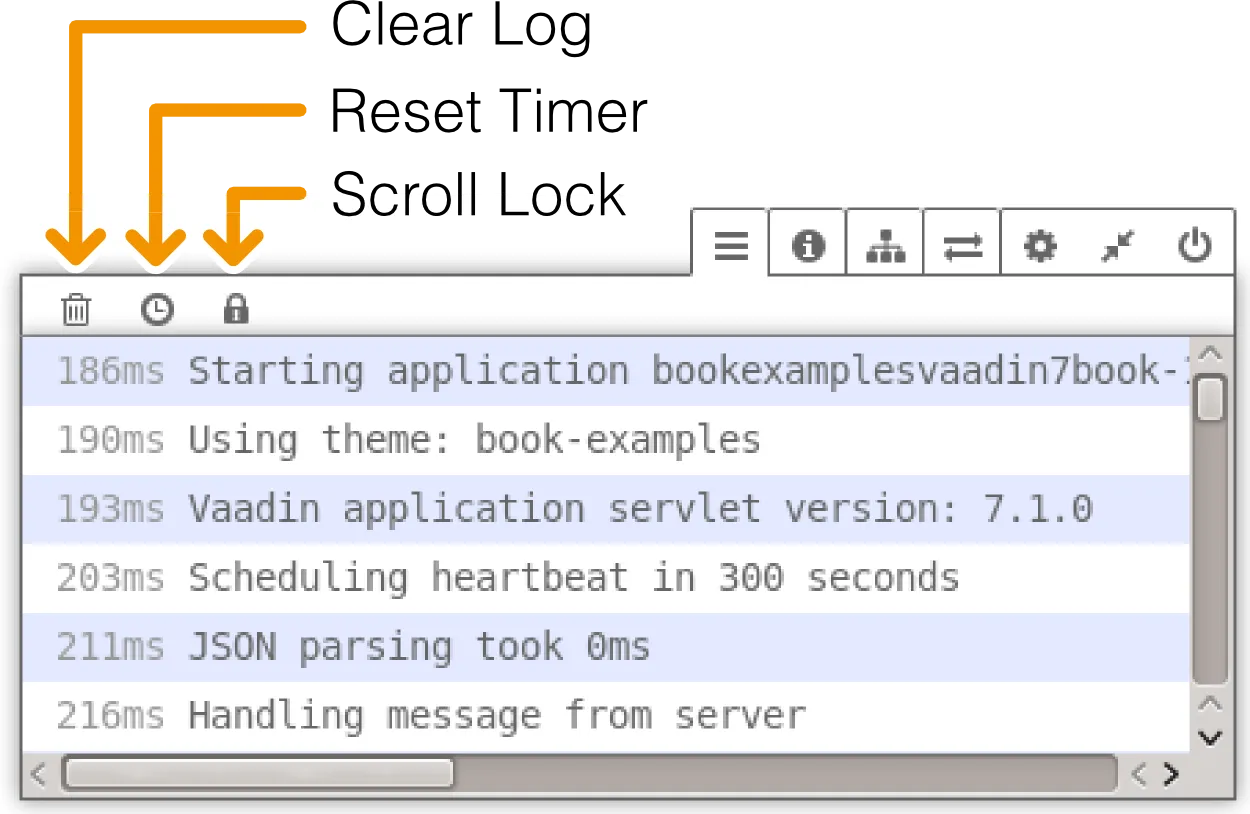
The debug message log displays client-side debug messages, with time counter in milliseconds. The control buttons allow you to clear the log, reset the timer, and lock scrolling.
Logging to Debug Window
You can take advantage of the debug mode when developing client-side components, by using the standard Java Logger to write messages to the log. The messages will be written to the debug window and Firebug console. No messages are written if the debug window is not open or if the application is running in production mode.
General Information
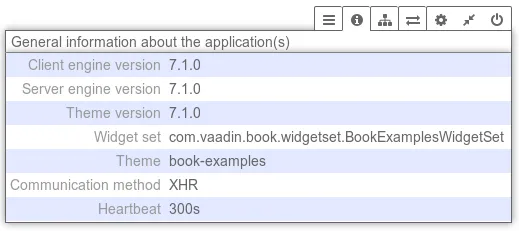
The General information about the application(s) tab displays various information about the UI, such as version numbers of the client and servlet engine, and the theme. If they do not match, you may need to compile the widget set or theme.
Inspecting Component Hierarchy
The Component Hierarchy tab has several sub-modes that allow debugging the component tree in various ways.
Connector Hierarchy Tree
The button displays the client-side connector hierarchy. As explained in "Integrating with the Server-Side", client-side widgets are managed by connectors that handle communication with the server-side component counterparts. The connector hierarchy therefore corresponds with the server-side component tree, but the client-side widget tree and HTML DOM tree have more complexity.
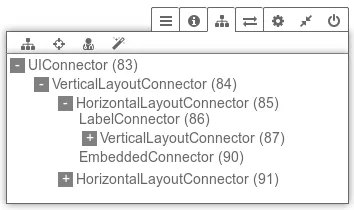
Clicking on a connector highlights the widget in the UI.
Inspecting a Component
The button lets you select a component in the UI by clicking it and display its client-side properties.
To view the HTML structure and CSS styles in more detail, you can use Inspector in Firefox or the Developer Tools in Chrome.
Analyzing Layout Problems
The Check layouts for potential problems button analyzes the currently visible UI and makes a report of possible layout related problems. All detected layout problems are displayed in the log and also printed to the console.
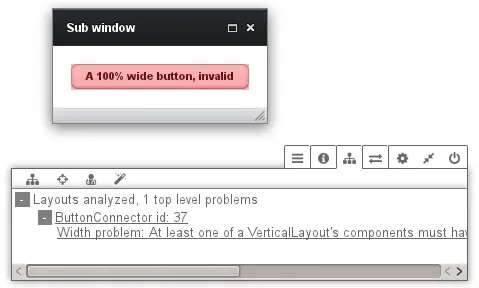
Clicking on a reported problem highlights the component with the problem in the UI.
The most common layout problem is caused by placing a component that has a relative size inside a container (layout) that has undefined size in the particular direction (height or width). For example, adding a Button with 100% width inside a VerticalLayout with undefined width. In such a case, the error would look as shown in Debug window showing the result of layout analysis..
CustomLayout components can not be analyzed in the same way as other layouts. For custom layouts, the button analyzes all contained relative-sized components and checks if any relative dimension is calculated to zero so that the component will be invisible. The error log will display a warning for each of these invisible components. It would not be meaningful to emphasize the component itself as it is not visible, so when you select such an error, the parent layout of the component is emphasized if possible.
Displaying Used Connectors
The last button, , displays a list of all currently visible connectors. It also generates a connector bundle loader factory, which you can use to optimize the widget set so that it only contains the widgets actually used in the UI. Note, however, that it only lists the connectors visible in the current UI state, and you usually have more connectors than that.
Communication Log
The Communication tab displays all server requests. You can unfold the requests to view details, such as the connectors involved. Clicking on a connector highlights the corresponding element in the UI.
You can use Firebug or Developer Tools in Firefox or Chrome, respectively, to get more detailed information about the requests and responses.
Debug Modes
The Menu tab in the window opens a sub-menu to select various settings. Here you can also launch the GWT SuperDevMode, as described in "Debugging Client-Side Code".