
Vaadin is a great tool for building dashboards. Typically, a dashboard is a screen containing information, metrics, key indicators, and other data points related to business processes. Dashboards allow managers to track and monitor the health and performance of their organization.
After seeing several dashboards that track the spread of the coronavirus, I wondered how hard (or actually, how easy) it would be to implement one with Spring Boot and, since I'm a Java guy, Vaadin for the front end.
The resulting source code is available on GitHub.
Consuming a REST web service
I started by searching for databases or REST web services to consume. There are many options, so this task took a while. Finally, I found one that seemed easy to use and had all the information I wanted for the app. Unfortunately, they stopped maintaining it after I finished the app. Fortunately, I found a good replacement, albeit with less functionality, but still enough for my purposes. Anyway, I estimate selecting the web service took approximately 2 hours.
The next step was to create a Spring Boot application and consume the web service. This was a breeze to implement with Feign. First, I needed a data model—the POJOs that would hold the data gathered from the REST web service. These POJOs can be generated automatically with an online tool using a sample JSON response. And that's what I did. I tweaked the generated classes to simplify them and to remove fields for data I didn't need. For example, two of the main classes are the Country and Timeline classes:
@Data
public class Country {

    private Coordinates coordinates;
    private String name;
    private String code;
    private Long population;
    private LatestData latest_data;
    private List<Timeline> timeline;

}


@Data
public class Timeline {

    private LocalDate date;
    private Long deaths;
    private Long confirmed;
    private Long recovered;
    private Long new_confirmed;
    private Long new_recovered;
    private Long new_deaths;

}
The @Data annotation comes from Lombok and generates getters and setters for the Java fields in the class. You can see the implementation of all the classes of the web service model on GitHub.
The REST client itself was very easy to implement (or actually, to not implement):
@FeignClient(name = "coronaapi", url = "${coronaapi.url}")
public interface WebService {

    @RequestMapping(value = "/countries")
    DataWrapper<List<Country>> countries();

    @RequestMapping(value = "/countries/{code}")
    DataWrapper<Country> countries(@PathVariable String code);

    @RequestMapping(value = "timeline")
    DataWrapper<List<Timeline>> timeline();

}
Feign provides the implementation of this interface at runtime. All I had to do was use the @FeignClient and @RequestMapping annotations to mark the interface and endpoints. The ${coronaapi.url} expression reads the value from a property in the application.properties file:
coronaapi.url=https://corona-api.com/
I also had to create a DataWrapper class since the web service returned the data inside a data object. You can see an example of the JSON that the service returns at https://corona-api.com/countries/fi. Here's the implementation of the wrapper class:
@Data
public class DataWrapper<T> {

    private T data;

}
To enable Feign, I used the @EnableFeignClients annotation as follows:
@SpringBootApplication
@EnableFeignClients
public class Application {
    ...
}
I did a quick test by creating a bean that used the interface to call the web service and voilà! The data from the web service was now in my Java objects. Cool! Completing this took 5 to 10 minutes of work.
Mapping web service objects to domain objects
When I had to switch from the first web service to the second (as mentioned earlier), I realized that having an independent domain model for the UI made sense. This will help if I have to change the provider again in the future. So I created a new Country class in a different package than the one for the web service:
@Data
@NoArgsConstructor
@AllArgsConstructor
@EqualsAndHashCode(onlyExplicitlyIncluded = true)
public class Country {

    @EqualsAndHashCode.Include
    private String isoCode;

    private String name;

    private Long population;

    private Long totalCases;

    private Long totalDeaths;

    private Long totalRecovered;

    private List<Day> days;

}
Here, I'm also using Lombok to generate not only getters and setters, but also a constructor with no arguments, a constructor with arguments for all the fields, and the equals and hashCode methods that check the id property. You can see the implementation of all the classes of the domain model on GitHub. These are the classes that the UI can use directly.
I also had to implement a service class that consumes the web service and maps between the domain model and the specific web service data model. The most interesting part is the interface that the UI can use (decoupling from implementations):
public interface CovidService {

    List<Country> findAll();

    Country getById(String id);

}
This interface uses the Country class defined in the domain model, and not in the potentially changing data model of the web service.
The implementation of this interface could look something like this:
@Service
public class CovidService implements org.vaadin.covid.service.CovidService {

    private final WebService webService;

    public CovidService(WebService webService) {
        this.webService = webService;
    }

    @Override
    public List<Country> findAll() {
        return webService.countries().getData().stream()
                .map(this::toDomain)
                .collect(Collectors.toList());
    }

    @Override
    public Country getById(String id) {
        if (GeoIpService.WORLD_ISO_CODE.equals(id)) {
            return getGlobal();
        } else {
            return toDomain(webService.countries(id).getData());
        }
    }

    private Country toDomain(
            org.vaadin.covid.service.coronaapi.model.Country c) {
        if (c != null) {
            List<Day> days = new ArrayList<>();
            if (c.getTimeline() != null) {
                days = c.getTimeline().stream()
                        .map(t -> new Day(
                                t.getDate(),
                                t.getConfirmed(),
                                t.getDeaths(),
                                t.getRecovered(),
                                t.getNew_confirmed(),
                                t.getNew_deaths(),
                                t.getNew_recovered()
                        ))
                        .collect(Collectors.toList());
            }

            return new Country(
                    c.getCode(),
                    c.getName(),
                    c.getPopulation(),
                    c.getLatest_data().getConfirmed(),
                    c.getLatest_data().getDeaths(),
                    c.getLatest_data().getRecovered(),
                    days
            );
        } else {
            return null;
        }
    }

}
You can see the full implementation of this class on GitHub.
Implementing a UI for a REST web service
The next step was to implement a view to show this data. It's interesting to see the first iteration I did, even though it only shows one Vaadin Chart in the dashboard:
@Route("")
public class MainView extends VerticalLayout {

    public MainView(CovidService covidService) {
        Chart chart = new Chart(ChartType.SPLINE);
        Configuration configuration = chart.getConfiguration();
        configuration.setTitle("Cumulative");
        configuration.getTooltip().setEnabled(true);
        configuration.getxAxis().setType(AxisType.DATETIME);

        DataSeries cases = new DataSeries();
        DataSeries deaths = new DataSeries();
        DataSeries recovered = new DataSeries();
        cases.setName("Cases");
        deaths.setName("Deaths");
        recovered.setName("Recovered");
        configuration.addSeries(cases);
        configuration.addSeries(deaths);
        configuration.addSeries(recovered);

        Country country = covidService.getById("FI");
        for (Day day : country.getDays()) {
            Instant instant = day.getDate().atStartOfDay()
                    .toInstant(ZoneOffset.UTC);
            cases.add(new DataSeriesItem(instant, day.getNewCases()));
            deaths.add(new DataSeriesItem(instant, day.getNewDeaths()));
            recovered.add(new DataSeriesItem(instant, day.getNewRecovered()));
        }

        add(chart);
    }

}
And here's a screenshot:
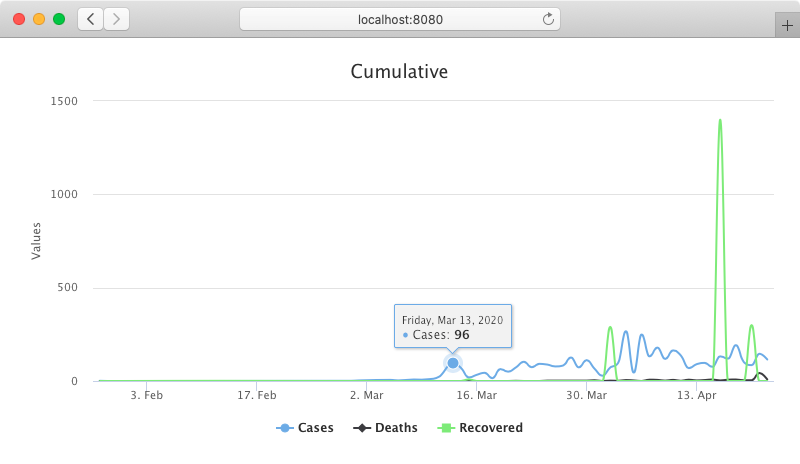
The code simply creates a new Chart object, gets its Configuration object to set the title, enable the tooltip that shows more details when the cursor hovers over a data point in the chart, and sets the type x-axis to DATETIME so that the chart knows that it has to render date formats.
Next, it creates DataSeries objects for each line in the chart. These objects are added to the Configuration object of the chart.
And last, it uses the service class to get a Country object (from the domain model) and for each Day object in the timeline, it adds a data point to the corresponding DataSeries object.
Adding responsiveness to the UI
A good dashboard should adapt to different screen sizes, so I wanted to add responsiveness to the UI. But I'm a Java developer and didn't want to spend too much time on CSS, so I used the Vaadin Board component.
I refactored the code to have a DashboardChart class with the logic to show a Vaadin chart, and created a new class to show a number (DashboardStats). You can see the implementations on GitHub. These are now reusable custom Vaadin UI components that I can add anywhere in the UI.
The Board component is simply a layout that adjusts its contents according to the screen size. It usage cannot be simpler:
public MainView(CovidService covidService) {
    Country country = covidService.getById("FI");

    Board board = new Board();
    board.addRow(
            new DashboardStats("Cases", country.getTotalCases(),
                    country.getPopulation(), "number-cases"),
            new DashboardStats("Deaths", country.getTotalDeaths(),
                    country.getTotalCases(), "number-deaths"),
            new DashboardStats("Recovered", country.getTotalRecovered(),
                    country.getTotalCases(), "number-recovered")
    );

    board.addRow(
            new DashboardChart(
                    "Cumulative",
                    ChartType.SPLINE,
                    country.getDays(),
                    Day::getCases,
                    Day::getDeaths,
                    Day::getRecovered
            ),
            new DashboardChart(
                    "Daily",
                    ChartType.COLUMN,
                    country.getDays().subList(0,
                            country.getDays().size() <= 7 ?
                                    country.getDays().size() : 8),
                    Day::getNewCases,
                    Day::getNewDeaths,
                    Day::getNewRecovered
            )
    );

    add(board);
}
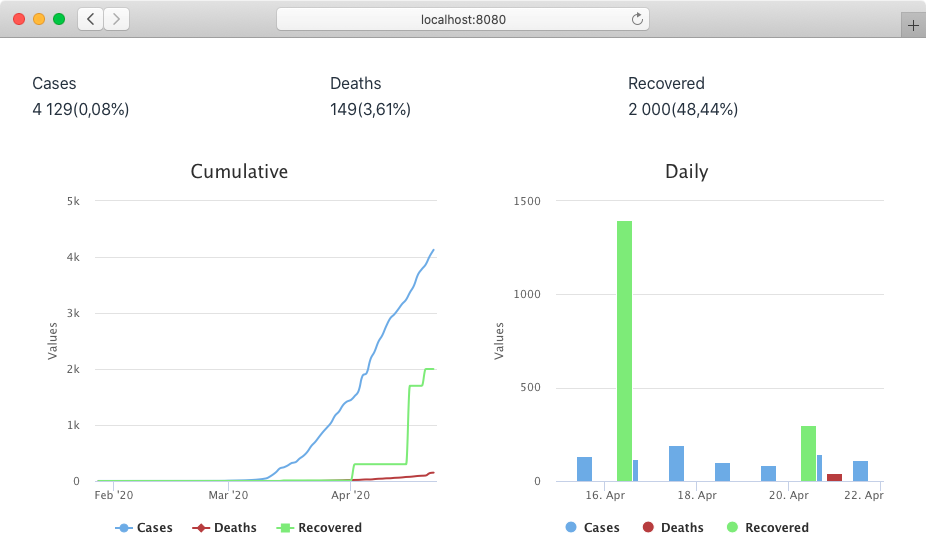
This code adds two rows to the board—one for numbers and one for charts. Depending on the size of the screen, the components are adjusted. Here's a screenshot of the app on a wide screen:
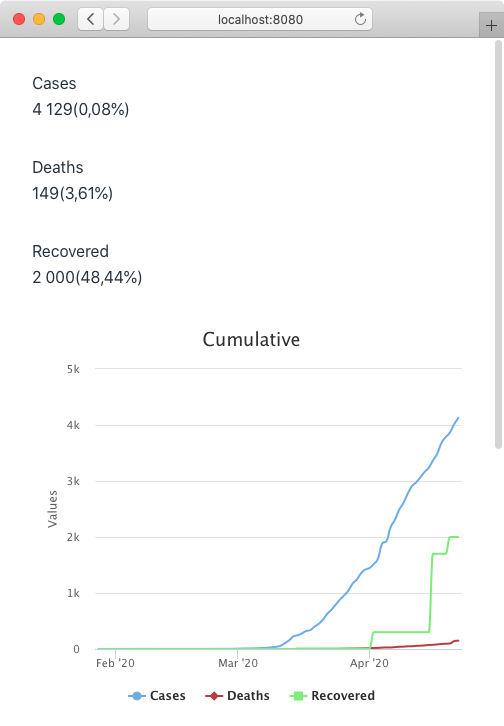
And here's one on a narrow screen, which is possibly what it would look like on a phone:
For this feature, I spent something like 1h, but that went mostly on code refactoring. Not bad at all!
Adding a cache
At some point I realized that I didn't need to query the REST web service every single time the user requested a view, since the data would most likely be the same as for the previous request. So I added caching to the service layer. With Spring, this can be done by using the @Cacheable annotation in the methods that return the data you want to add to a cache. For example:
@Service
public class CovidService implements org.vaadin.covid.service.CovidService {

    public static final String COVID_SERVICE_CACHE = "covid-service-cache";

    ...

    @Override
    @Cacheable(cacheNames = COVID_SERVICE_CACHE)
    public List<Country> findAll() {
        ...
    }

    @Override
    @Cacheable(cacheNames = COVID_SERVICE_CACHE)
    public Country getById(String id) {
        ...
    }

    ...

}
To enable the cache I used the @EnableCaching annotation and added a CacheManger as follows:
@SpringBootApplication
@EnableFeignClients
@EnableCaching
public class Application {

    ...

    @Bean
    public CacheManager cacheManager() {
        return new ConcurrentMapCacheManager(
                CovidService.COVID_SERVICE_CACHE);
    }

}
Since I needed the app to still fetch the data from the web service when it was updated, I consulted their documentation and found that they update the data every few hours. So I decided to schedule a cache eviction every 6 hours using the @Scheduled and @CacheEvict annotations as follows:
@Service
public class CovidService implements org.vaadin.covid.service.CovidService {

    ...

    @Scheduled(cron = "${coronaapi.cache.evict.cron}")
    @CacheEvict(cacheNames = COVID_SERVICE_CACHE, allEntries = true)
    public void clearCache() {
    }

}
I configured the cron expression in a property in the application.properties file like this:
coronaapi.cache.evict.cron=0 0 */6 * * *
I estimate I spent maybe a couple minutes adding all this to the app.
Other things to consider when developing dashboards
I thought it'd be a good idea to add a header and a footer, which I implemented using core Vaadin components such as H1, Image, HorizontalLayout, Text, and Anchor.
A good dashboard should also include the possibility to somehow customize what it displays (for example by selecting a country), and the ability to bookmark and share views (for example different URLs for different countries). I implemented this using the HasUrlParameter interface and a ComboBox with a click listener that would navigate to the correct URL according to the country selected. In the HasUrlParameter::setParameter method, I coded the logic to show the data corresponding to the ISO code of the country passed as a parameter.
Since I was planning to publish the dashboard on the internet, I had to add a cookie consent dialog. Again, this was very easy to do. A one liner actually:
...
public class MainView extends VerticalLayout {
    ...

    public MainView(...) {
        add(
                new CookieConsent(),
                title,
                board,
                footer
        );
    }

    ...
}
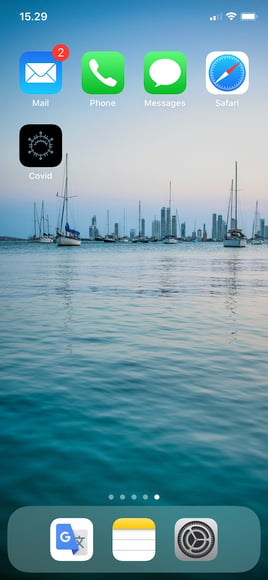
Another feature I wanted to include in this example application was the possibility for it to be installed as a PWA on phones. This is super easy to do with Vaadin:
@PWA(name = "Covid Dashboard", shortName = "Covid",
        description = "A Covid-19 dashboard app")
@Route("")
public class MainView extends VerticalLayout {
    ...
}
I also added a custom icon to the project (src/main/webapp/icons/icon.png). With this annotation, Vaadin generates what's required by the browser to allow adding a shortcut to access the application from the home screen on phones:
After playing with the application and evolving it to what I wanted, I ended up with something like this:
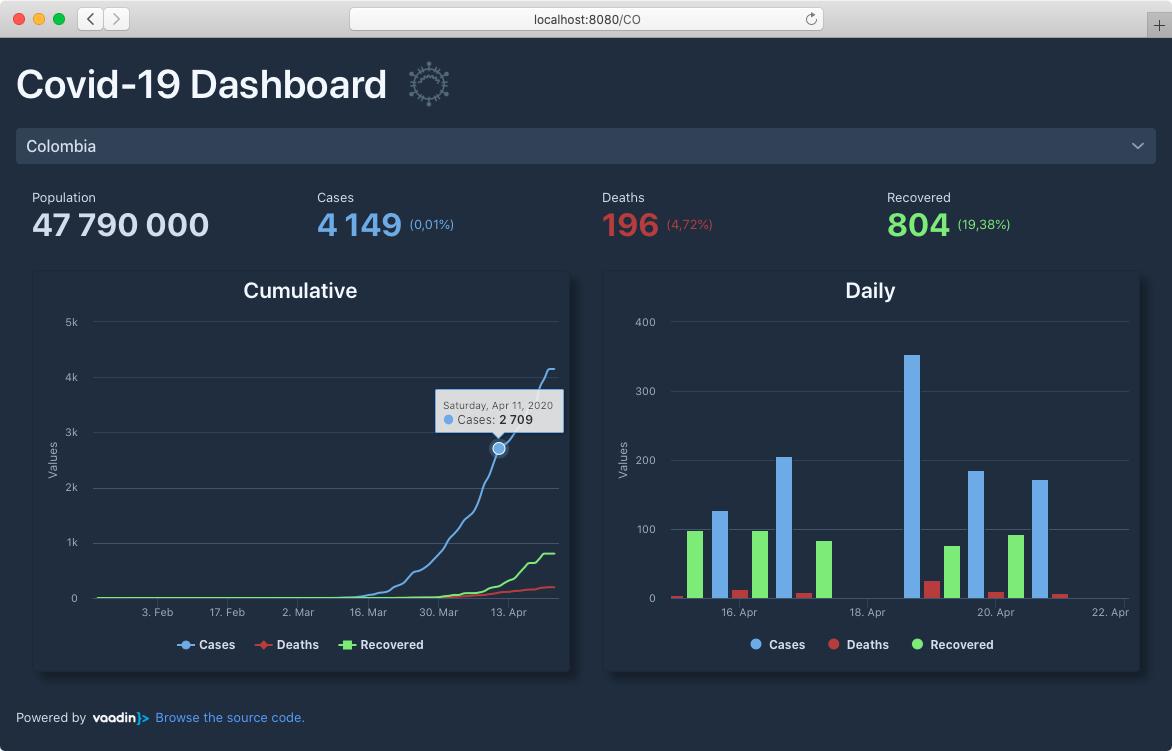
You can find the full implementation of the final view on GitHub and try the running app at https://alejandro.app.fi/covid-dashboard.
Conclusion
In total, it took me a couple of days to get the application to the state it is in right now. This includes searching for an existing free web service, changing the web service provider at least once (I tried several, actually), and deploying to production, as well as implementing the application itself.
I used several free Vaadin components and some commercial ones. After finishing this project, I can confidently say that the components included in the commercial offering definitively increased my productivity.