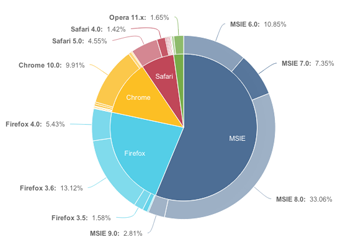
What is Vaadin Charts?
In a nutshell, Vaadin Charts is the de-facto charting component for Vaadin 7.
 Vaadin Charts is powered by the Highcharts JS library and it offers a Server-Side Vaadin API to utilize all the chart components that Highcharts provides.
Vaadin Charts is not just a Highcharts wrapper though. It also merges Vaadin Timeline, familiar to Vaadin 6 users, into the same product. (The implication of this is that Vaadin Timeline will not be released as a standalone add-on for Vaadin 7)
As a result of combining these components, we can now offer the most comprehensive data visualization add-on released to this date for Vaadin development.
Check out the product home page for more information.
Call for Vaadin Charts Beta testers
Vaadin Charts Beta is available from Vaadin Directory today! This milestone is also an open invitation for all Vaadin developers to participate in Beta-testing of Vaadin Charts. Give your feedback and influence the final product!
The Beta phase will last for a month and the final release is scheduled for 21st of February, 2013. For Beta testing you can use the 30-day trial period that is granted to all commercial Vaadin Add-ons.
In exchange for helping us out we will be giving away one year Pro Account subscriptions (value 1080 USD) to five developers. Pro Account includes also a free license for Vaadin Charts.
As soon as the Beta phase ends we will review the tickets that have been entered to the Vaadin Trac - Vaadin Charts Backlog. We will contact directly the five Beta testers whose contribution we value the most and reward them with a free Pro Account.
How to get started?
The best way to get started is to download Vaadin Charts Beta from Vaadin Directory.
You will find a README file inside the downloaded package that contains the instructions for installation. For Maven users there is a Vaadin Charts dependency snippet that you can add to your Vaadin 7 project.
Once you have your project configured, you want to check some examples, right? For this you should visit the Vaadin Charts demo that demonstrates all supported chart types. You can also find source code for each chart type displayed, ready to be cut&pasted into your own project.
Hopefully a visit to the demo site will feed your inspiration and you’ll be able to find the best chart to visualize data in your own application.
Once you get into the coding, there are other online resources that you might find helpful.
If you have any questions or ideas regarding Vaadin Charts, feel free to ping me about them.
samik@vaadin.com