
In previous articles of this series, we discussed high availability and fault tolerance capabilities to make services resilient to failures in external services. In this article, we’ll add “health endpoints” and implement a dashboard to visually monitor service status.
Why do we need this?
Microservices provide benefits. However, they come with costs. An evident cost of microservices is the increase in complexity. With more parts in a system, the challenge to fully understand and troubleshoot performance problems grows. Monitoring health in microservices helps to understand the overall performance of the system and detect individual points of failure.
How does it work?
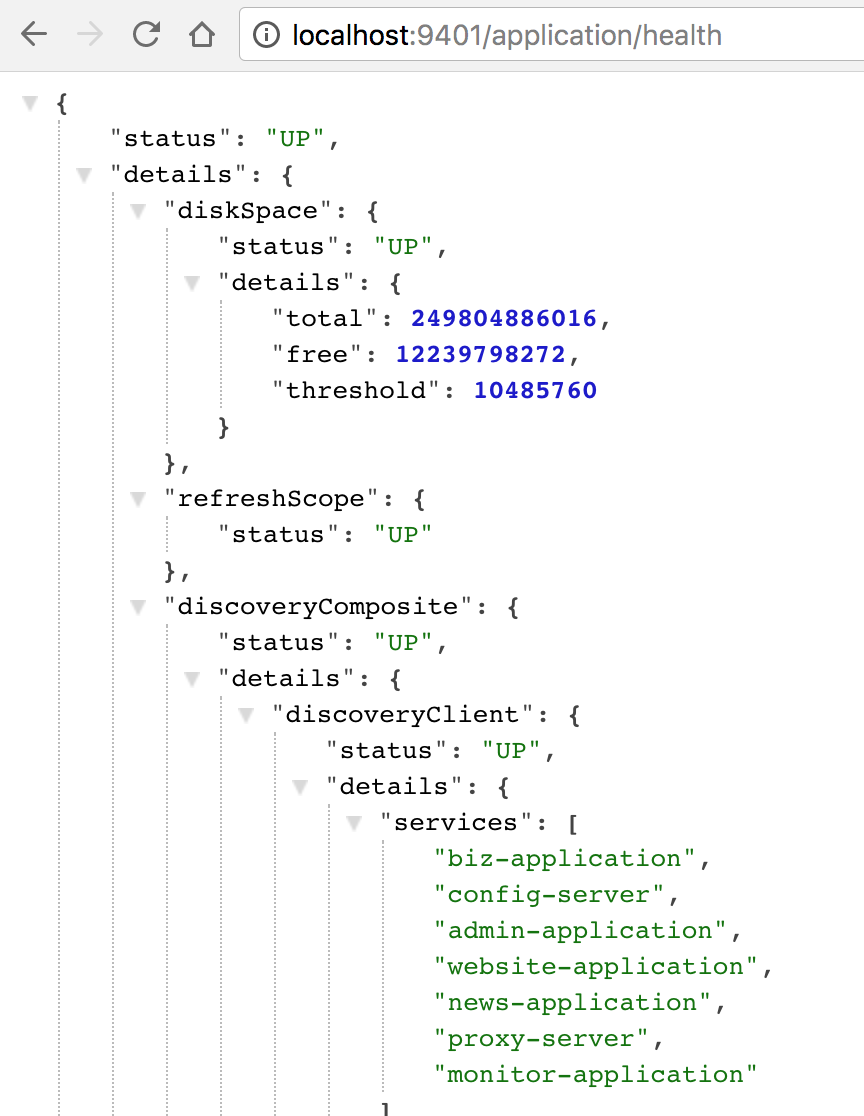
Microservices expose a health endpoint with information about the status of the service. A monitor application keeps track of this data, aggregates it, and presents the result in a dashboard. For example, the admin-application exposes a health endpoint at application/health. If you have an instance running on port 9401, you can request http://localhost:9401/application/health to see health information similar to the following:
Adding health endpoints with Spring Boot Actuator
In order to add a health endpoint to a Spring Boot application, you need to add the following dependency to your pom.xml file:
<dependency>
   <groupId>org.springframework.boot</groupId>
   <artifactId>spring-boot-starter-actuator</artifactId>
</dependency>
Although Spring Boot includes many endpoints, we are interested in activating the health endpoint. You can activate it by adding the following to your configuration file:
endpoints.health.enabled: true
The example application enables the health endpoint for the biz-application, the admin-application, the news-application, the website-application, the proxy-server, and the monitor-application itself (we’ll see how to implement this application in the next section).
Implementing a monitor dashboard
Use Spring Initializr to create a new Spring Boot application named monitor-application and include the Hystrix Dashboard, Turbine, Actuator, and DevTools (optional) dependencies.
Open up the MonitorApplication class and enable the Hystrix Dashboard by using the following annotations:
@SpringBootApplication
@EnableHystrixDashboard
@EnableTurbine
public class MonitorApplication {
   ...
}
Remove the application.properties file and create a new bootstrap.yml file with the following content:
spring:
  application.name: monitor-application
  cloud.config:
    discovery:
      enabled: true
      serviceId: config-server

eureka:
  client:
    serviceUrl:
      defaultZone: http://localhost:7001/eureka/
    registryFetchIntervalSeconds: 1
  instance:
    leaseRenewalIntervalInSeconds: 1
Add a new monitor-application.yml file to your external configuration with the following content:
endpoints.health.enabled: true

turbine:
  appConfig: biz-application, admin-application, news-application, proxy-server
  clusterNameExpression: "'default'"
  instanceUrlSuffix: application/hystrix.stream
This configures an aggregator (Turbine) for the health stats from the biz-application, admin-application, news-application, and proxy-service services.
Make sure you are running all the services of the example application, and compile and run the monitor-application by executing the following in the command line:
cd vaadin-microservices-demo/monitor-application

java -Dserver.port=9801 -jar target/monitor-application-0.0.1-SNAPSHOT.jar
Point your browser to http://localhost:9801/hystrix and introduce http://localhost:9801/turbine.stream as the stream URL. Click the Monitor Stream button to see a dashboard like the following:
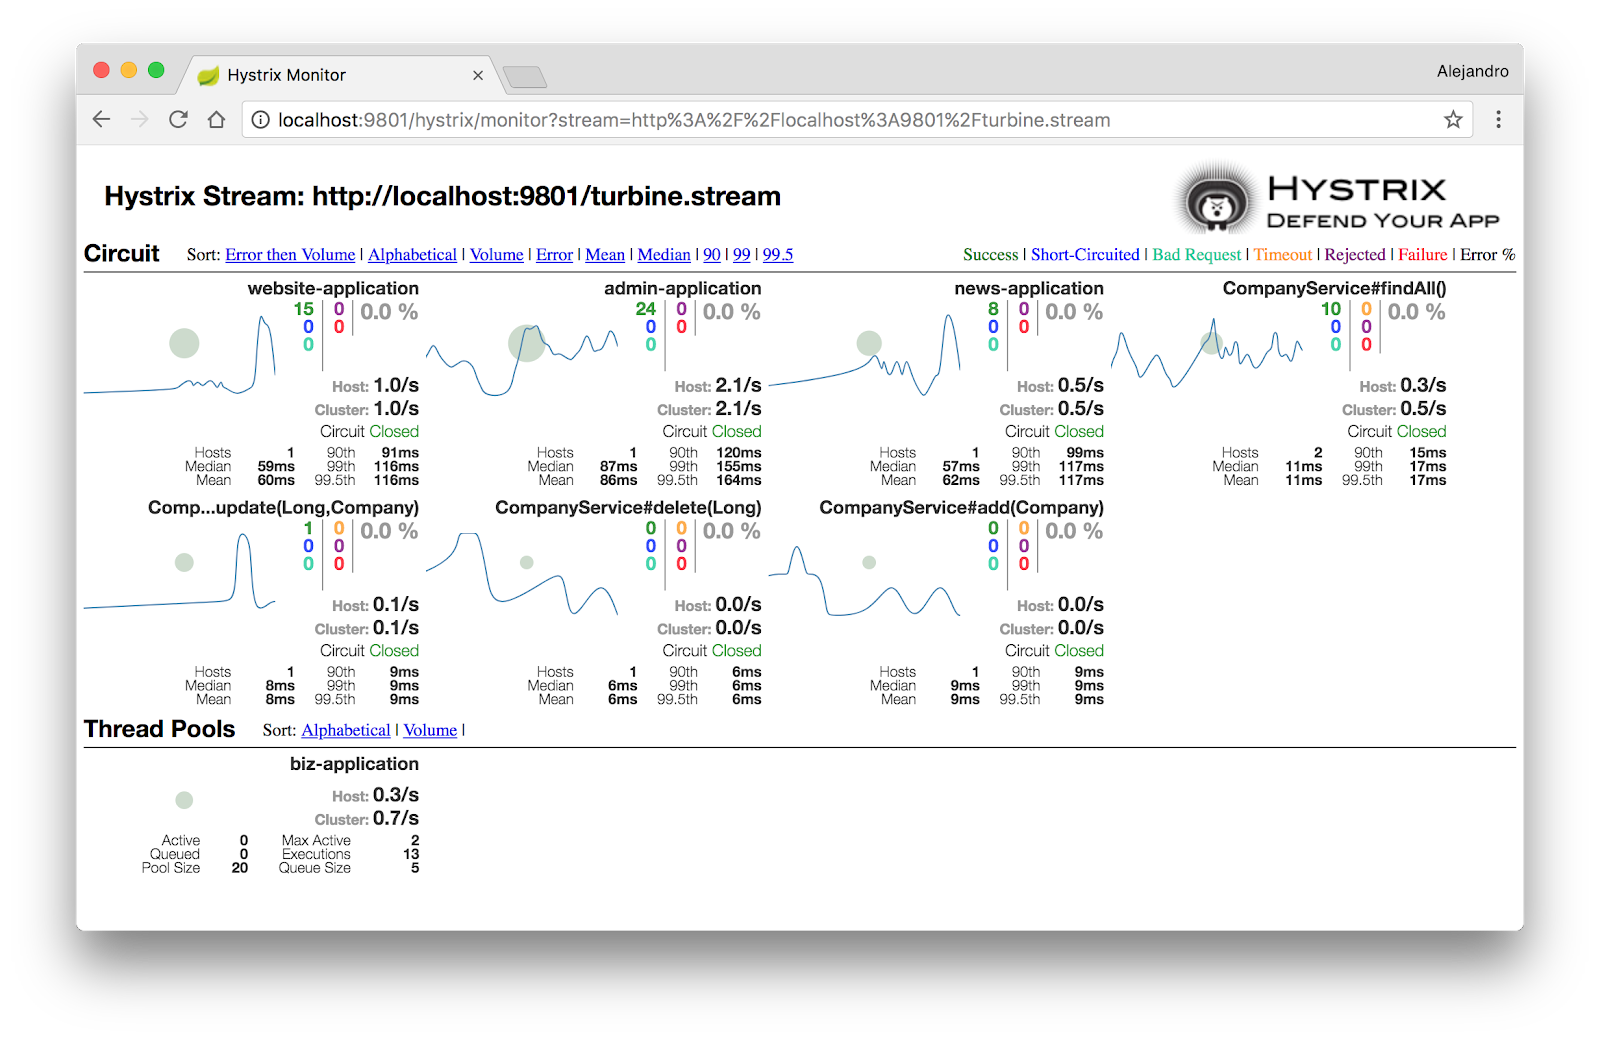
Try using all the features of the application (http://localhost:8080) and shutting down some services to see how the dashboard reacts.
Although there’s much more about monitoring, and microservices in general, I hope this series of articles gave you an idea of some of the key concepts, patterns, and challenges you may encounter.
Learn more about Vaadin for Spring Applications