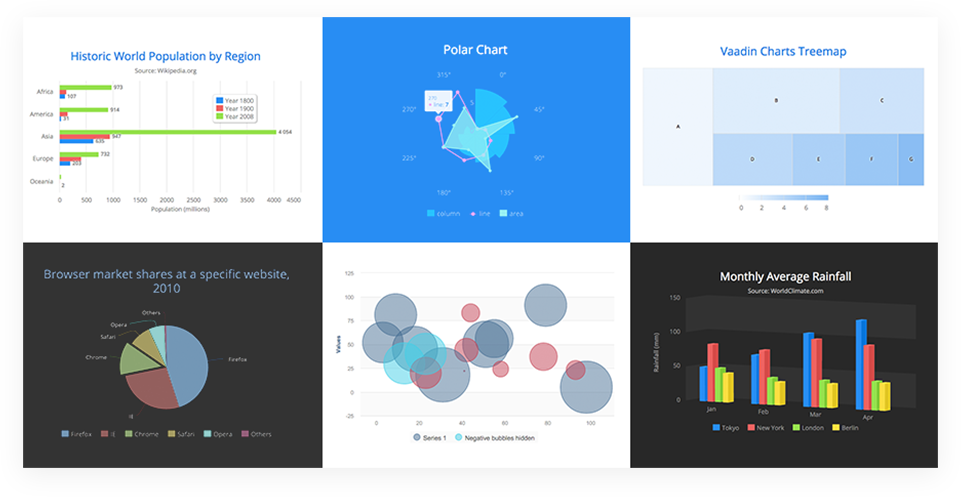
Vaadin Charts 3.2 is here. With the latest release, we continue to cater to the newest client-side libraries. The new version brings you improved integration to the React JavaScript library. Before version 3.2 you were able to use Vaadin Charts for your React charts, but you had to write a bit more boilerplate code than we were comfortable with. Now the integration is a lot smoother.

I’ll cover the five simple steps you need to take to get Vaadin Charts into use in your React application. I assume you are using Browserify (and npm). If you don’t have such a React project at hand, you can use one from here https://github.com/samiheikki/react-starter-kit
1. Install the Vaadin Charts dependency with Bower
bower install --save vaadin-charts
2. Add Web Components polyfill to your index.html to be able to use HTML imports
<script src="bower_components/webcomponentsjs/
    webcomponents-lite.min.js">
3. Import your choice of a chart type
<link rel="import" href="bower_components/vaadin-charts/
    vaadin-pie-chart.html">
4. In your index.js import the Vaadin Charts component before React
// Must be imported before React
require('./bower_components/vaadin-charts/react');
var React = require('react');
var ReactDOM = require('react-dom');
5. Configure your chart and its data series in the render function using the declarative Elements API.
var MyPie= React.createClass({
  getDefaultProps: function() {
    return {
      data: []
    };
  },
  render: function() {
    return (
      <vaadin-pie-chart>
        <title>My First</title>
        <subtitle>Pie Chart</subtitle>
      <data-series name="My data">
        <data>{this.props.data.map(JSON.stringify).join(',')}</data>
      </data-series>
    </vaadin-pie-chart>
    )
  }
});

ReactDOM.render(
  // e.g. [["Hey", 1], ["What's", 2], ["Going", 3], ["On", 0.5]]
  <MyPie data={getMyExampleChartJSONData()}/>,
  document.getElementById('example')
);
Take a look at more detailed usage examples in the reference documentation of Vaadin Charts in Vaadin Docs. See all the chart types and a lot of the features in action, visit the Vaadin Charts demo site at http://demo.vaadin.com/vaadin-charts/.
