We’re currently building the next version of Vaadin Charts which will include a web component API in addition to the Java API. Vaadin Charts is the first chart library in the world with a comprehensive web component API. Now you can easily add charts to your web pages in a clean and familiar way. With the help of custom elements, it is as easy as writing basic HTML.
You can try it out already today with the beta releases. This is how to get started in as little as a few minutes.
Getting started
You can download Vaadin Charts 3 directly if you like, but the easiest way to get started is to use Bower. Create a new folder and install vaadin-charts within it.
$ bower install --save vaadin-charts
This will download vaadin-charts and all of its dependencies.
Creating the page
Next we need to create a page where we want to show our chart. Create a new index.html file in the same directory where you used Bower and add Vaadin Charts to it.
<!DOCTYPE html>
<html>
<head>
  <title>Charts are awesome</title>
  <link rel="import" href="bower_components/vaadin-charts/vaadin-line-chart.html">
  <script src="bower_components/webcomponentsjs/webcomponents-lite.min.js"></script>
</head>
<body>
  <vaadin-line-chart></vaadin-line-chart>
</body>
</html>
Let’s go through the code. First we import a chart type to our project. Every chart type is a web component in itself, so you can replace vaadin-line-chart with any other chart type as well. We also import webcomponents.js which is a polyfill to make web components work in browsers which do not support them yet natively. Today that’s all browsers except Google Chrome. (To read more on Web Components see http://webcomponents.org). Lastly we add the custom element
You can now serve the content and check it out in your browser. There are again multiple ways to do it but one of easiest is using a tool called serve and point your browser to http://localhost:3000. At this point you will get a license popup if you don't have a license installed yet.
$ serve
serving /Users/Peppe/Dev/Charts on port 3000
Configuring the chart
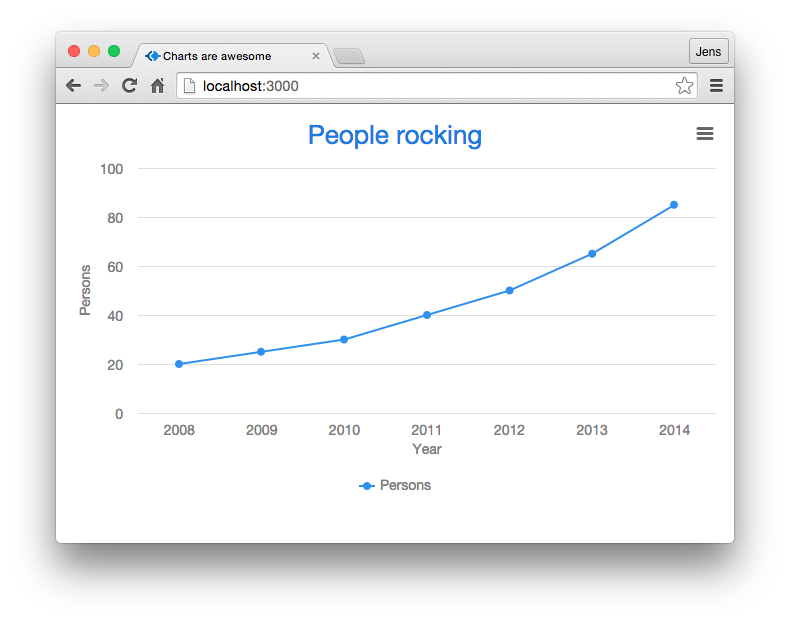
The chart loads up in the browser but it looks a bit empty as we haven’t configured anything to it yet. Let’s add some data.
<vaadin-line-chart>
  <title>People rocking</title>
  <data-series name="Persons">
    <data>20,25,30,40,50,65,85</data>
  </data-series>
  <y-axis>
    <title>Persons</title>
  </y-axis>
  <x-axis>
    <title>Year</title>
    <categories>2008,2009,2010,2011,2012,2013,2014</categories>
  </x-axis>
</vaadin-line-chart>
We define a title to the graph which will be shown at the top. Then we add a set of data with
By reloading the browser we now see a fully functional chart!

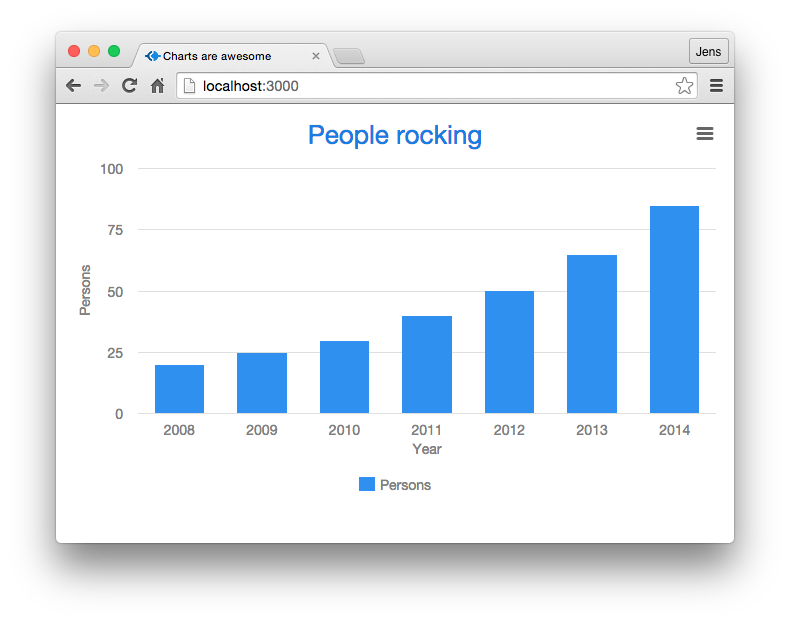
All the charts also share the same API so you can easily change one chart type to another. Just change the import and the main element type:
...
<link rel="import" href="bower_components/vaadin-charts/vaadin-column-chart.html">
...
<vaadin-column-chart>
...
</vaadin-column-chart> (3)
...

From here on it is up to you to decide what to do. You can add a second set of data by adding another <data-series>. You can hook the chart up to an external data source by using the <iron-ajax> web component. You can configure the names, styles and colors. Check out more examples of Vaadin Charts 3 for Web Components at http://demo.vaadin.com/vaadin-charts and the API at http://demo.vaadin.com/vaadin-charts-api. Documentation and broader tutorials are found in Vaadin Docs. Check also our examples on how to integrate Vaadin Charts with Angular, React, jQuery and Polymer.
<!DOCTYPE html>
<html>
<head>
  <title>Charts are awesome</title>
  <link rel="import" href="bower_components/vaadin-charts/vaadin-column-chart.html">
  <script src="bower_components/webcomponentsjs/webcomponents-lite.min.js"></script>
</head>
<body>
  <vaadin-column-chart>
    <title>People rocking</title>
    <data-series name="Persons">
      <data>20,25,30,40,50,65,85</data>
    </data-series>
    <y-axis>
      <title>Persons</title>
    </y-axis>
    <x-axis>
      <title>Year</title>
      <categories>2008,2009,2010,2011,2012,2013,2014</categories>
    </x-axis>
  </vaadin-column-chart>
</body>
</html>

