Vaadin Charts 3.0 has reached the beta stage and is approaching the final release. It’s not yet ready for production, but definitely deserves your attention. New financial chart types, flags series and the completely overhauled timeline are the major highlights in this new version. In addition to the Vaadin Framework users, we are now presenting this product to Vaadin Elements audience, too. You can get your hands on the new beta today.
Vaadin Charts is heading to Wall Street
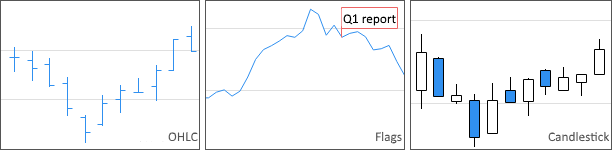
Charts 3.0 brings you two new chart types meant especially for financial graphs: OHLC (Open-High-Low-Closed) and candlestick.
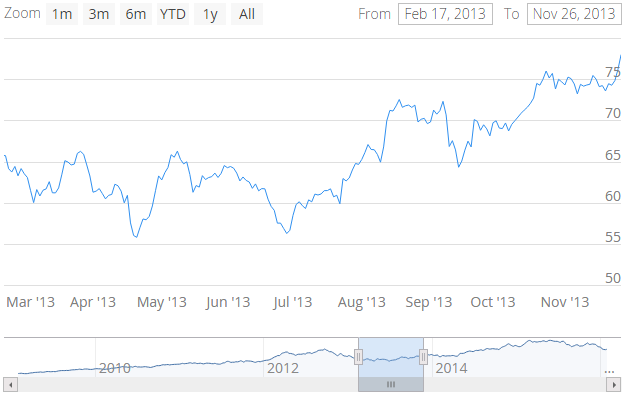
With Charts 3.0 we threw away the old Timeline component and replaced it with a much more capable timeline mode. You can enable the timeline mode for any chart that has a time axis. Enabling timeline mode allows your users to view a certain time range of the data set using a sliding range selector.
Flags series is a nice way to attach annotations to your charts. You can add event markers to the graph or the X axis. Each marker can have a different customized visual style.
Vaadin Charts for client-side developers
Vaadin Charts 3.0 beta is available for the Web Components developers too. The custom Chart Elements offer you unbeatable data visualization and interaction coupled with declarative and dynamic data binding. The pure client-side version is built with Polymer and it doesn’t require any specific backend implementation. It works in any browser client that support Web Component polyfills. The Java version is meant to be used with Vaadin Framework. The feature set is identical in both flavors, but the programming model is completely different.
Migration is easy when you have help
Vaadin Charts 3.0 Java API is not entirely compatible with the Charts 2.0 API. We have written a migration guide to help you to the new API. It’s available here.
Test drive the new Vaadin Charts
Whether you are into Vaadin Elements or Vaadin Framework, you can have the new financial chart types and other new stuff today.