
JMeter is one of the most popular performance testing tools. First released at the end of 1998, JMeter became the default choice for many companies needing to measure the performance of their software. In 2016, it was estimated that half of all companies performing load tests used JMeter. It is written in Java and can be run on any operating system compatible with Java. It is a perfect choice for load testing a Vaadin application.
Note this is the third post in our Performance testing a Vaadin application blog series. For an introduction to the subject, see Part 1. Performance testing a Vaadin application, see Part 2.
Building a test script
Building a test script starts with recording user interaction with a browser. JMeter is configured to function as a proxy between a browser and a server. The browser (usually Firefox) is configured to listen to the port defined in JMeter. In this way, JMeter is able to intercept the traffic and requests.
JMeter provides a built-in template named Recording to simplify setup. When you select it from the list of available templates, a pregenerated Test Plan is added automatically:

HTTP(s) Test Script Recorder
The HTTP(s) Test Script Recorder element is of most interest to us. It allows JMeter to capture and store requests resulting from user actions while browsing the tested web application in a regular browser.
You can specify intercepted requests that should not be added into the final script. The suggested elements to exclude are:
- Images, fonts and similar elements.
- Custom patterns to ignore, such as accidental Firefox requests. These are defined at HTTP(S) Test Script Recorder > Requests Filtering > URL Patterns to Exclude.
We suggest you rely on JMeter’s functionality to fetch static resources by selecting Retrieve All Embedded Resources in the Advanced tab of a request that triggers static file downloads. This way, JMeter will be able to simulate browser behaviour and download the resources in parallel. This also means that you do not need to keep the request to static resources up to date.
Thread Group
The Thread Group element is at the heart of the test. It contains requests (in this case HTTP requests), as well as logic controllers that define how the requests should be executed. You can also define the number of simultaneous users and ramp-up settings here. By default, recorded HTTP requests are stored as samples under the Recording Controller, which is usually added under the Thread Group.
Adjusting the test script
Once you have recorded the interaction of a user with the system under test (SUT), captured requests are saved under the Recording Controller element.
Unless you disable CSRF protection, replaying the recorded script as it will not work: an appError with syncId:-1 will be returned and you will find the Invalid security key received from 127.0.0.1 error in the server log. This is because you are using a previously recorded csrfToken, which is unique for each run.
To make the script executable, you need to extract the token from the first server response and substitute it for every request that follows. As the token is in UUID format, a regular expression can be applied to the first request to retrieve the token.
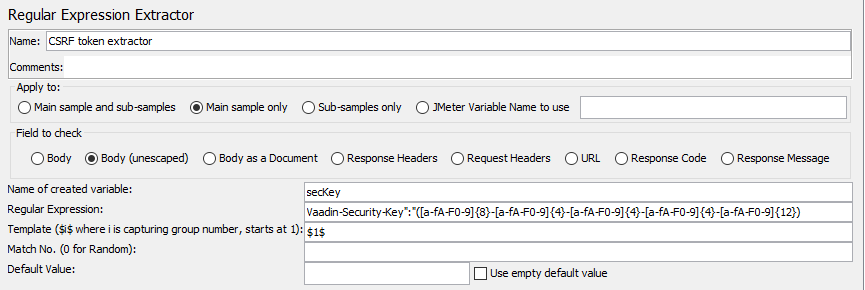
The extracted token can be used in subsequent requests using the JMeter reference syntax: ${secKey}.
Strictly speaking, this is the only required step to replay the script. However, it’s vulnerable to any changes made in the UI and even adding a label that is not used by a test could break it. For this reason, we suggest you also extract (in the same way) the synchronization tokens (syncId and clientId), as well as the node values of the most-used elements in the script.
Of course, parameterizing all of the attributes and parameters is the best possible option, but it’s hardly doable manually. The original request would look similar to this:
{csrfToken:"3989a096-7ddf-4b5d-9568-12605d70735d",
"rpc":[{"type":"publishedEventHandler",
"node":345,
"templateEventMethodName":"confirmUpdate",
"templateEventMethodArgs":[1]}],
"syncId":2,
"clientId":2}
whereas, it could look like this:
{"csrfToken":"${secKey}",
"rpc":[{"type":"publishedEventHandler",
"node":${gridsNodeId},
"templateEventMethodName":"confirmUpdate",
"templateEventMethodArgs":[1]}],
"syncId":${syncId},
"clientId":${clientId}
}
You can take a look at simple example JMeter tests here. It contains example regular expression extractors for extracting csrfToken, clientId, syncId, and one node id.
What is next?
To mimic a production environment as closely as possible, it’s often necessary to pass dynamic data to the test. For example, this could mean that a random value from a combobox should be selected. Each component has its own logic (for example, a physical position defines the selected key), but it’s essential to instruct JMeter to generate data randomly or select it from the passed values. You can read more about this at BlazeMeter: 3 Ways to Generate Random Variables in JMeter.