A great web application needs awesome graphs to visualize data in a human-readable form, so let’s have a look at how to add some to yours. Let’s first consider the different options we have for creating charts; Vaadin Pro and Prime come with Vaadin Charts, Vaadin Directory has several add-ons for Charts and there are several chart JavaScript libraries on the Internet you could integrate.
 Using ready-made tools
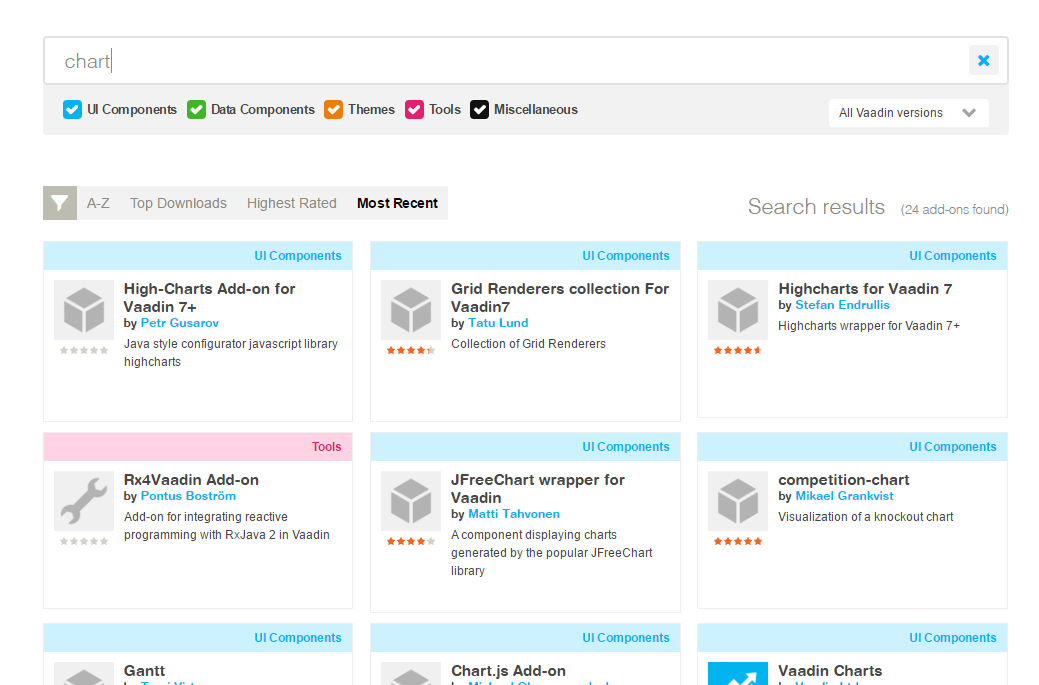
The easiest way to get started is by using Vaadin Charts, but if a commercial option isn’t viable for you, Vaadin Directory is the place for finding free add-ons for your web application. A simple directory search reveals multiple options that allow graph implementation in Java.
Some of the add-ons don’t support Vaadin 8 yet, so be sure to pick something that does.
 DIY solution
Of course, a true programmer can tackle any problem by doing stuff themselves. But to keep things somewhat simple, let’s search for a good library that not found in Vaadin Directory and implement that as an addon. This is probably the cheapest but most cumbersome solution – yet it is doable with a little bit of work.
 Vaadin Charts
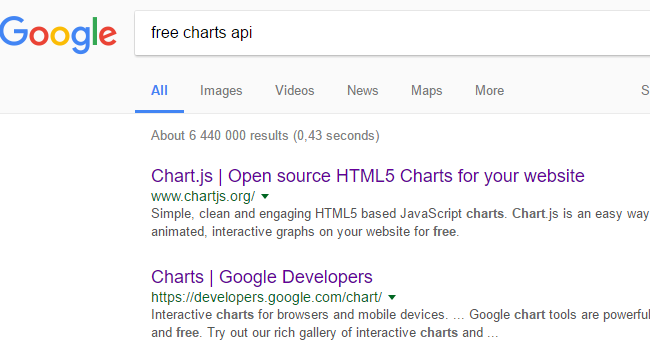
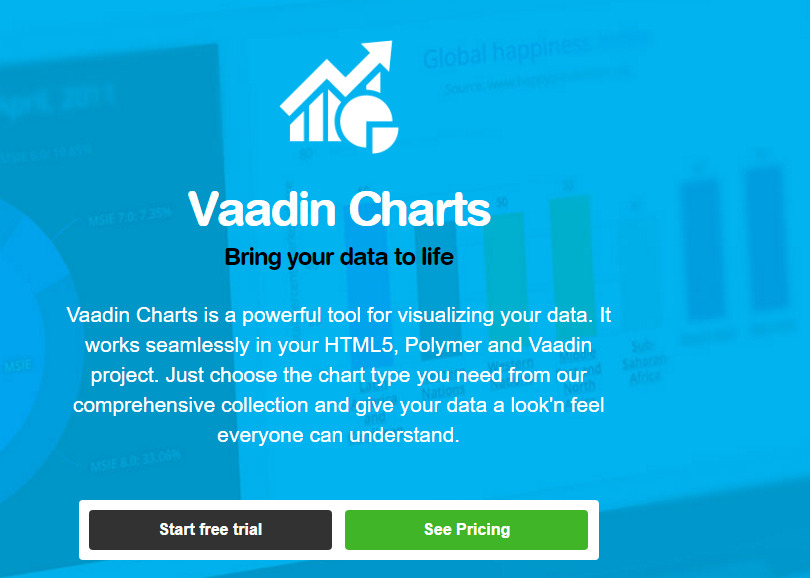
Vaadin Charts will pop up in both Directory and your Google searches. It is a powerful and easy to use graph library and it’s guaranteed to work over version changes. Unfortunately, it doesn’t come free, but this is the case for other good charts libraries as well. Vaadin Charts’ benefit is that it’s good looking and integrates with your Vaadin app seamlessly.
Test case
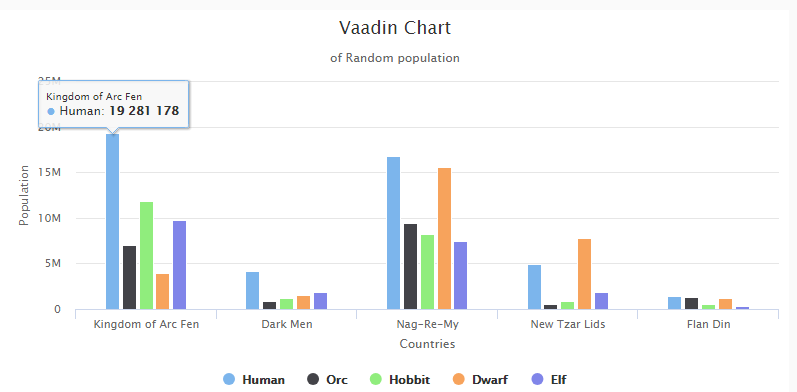
After choosing the different approaches, let’s give them a try and see the results. Our test scenario is simple: we have different fantasy creatures living in different countries and we want to have an easy view (column chart) on this given data (5 countries, 5 creatures => a column chart with 5 groups). All charts will be built “out of the box”, meaning using default styling and without too much tweaking. Although we have a fixed and simple test-case with an out-of-the-box set we will also take a look at these different graph libraries’ diversity and customizability.
Case 1 - Vaadin Charts
Vaadin Charts are easy to use and well documented and the source code turns out as follows:
Chart chart = new Chart(ChartType.COLUMN);
Configuration conf = chart.getConfiguration();

conf.setTitle(Title);
conf.setSubTitle(subTitle);
// Add x-axis groups
XAxis xAxis = conf.getxAxis();
xAxis.setTitle(xTtitle);
xAxis.setCategories();
categories.forEach(s -> xAxis.addCategory(s));

// Set title
YAxis yAxis = conf.getyAxis();
yAxis.setTitle(yTitle);

// Add data
data.forEach((s, stringNumberHashMap) -> {
   ListSeries series = new ListSeries(s);
   stringNumberHashMap.forEach((s1, number) -> {
       series.addData(number);
   });
   conf.addSeries(series);
});
return chart;
The results are very good looking. By default, it reacts to user actions, such as legend clicks, and it’s also totally size-responsive, meaning it works in different browser window resizes.
Apply for a trial license, get pro-subscription or just buy only charts.
- License:
- commercial
- Pricing:
-
Included in Vaadin Pro and Vaadin Prime (Starting from $100 / month / developer).
or
Free for educational purposes - Pretty-factor:
- 5/5
- Ease of use:
- 5/5
- Diversity:
- 5/5, tons of different charts + the combinations so there’s something for almost any scenario
- Customizability:
- 5/5 Using own styles is a breeze and callbacks to different actions give full strength on user experience. All in plain Java.
- Link(s):
- https://vaadin.com/charts
Case 2 - Highcharts
Highcharts has an add-on in Vaadin Directory, so it’s somewhat easy to use. The problem is that it is really a way to send raw json to the browser-side Highchart library. So it’s all about a big JSON string creation without any help of javadoc. Of course, Highchart itself is very well documented, but it’s still one thing when coding in Java and another thing having to create json-string for a JavaScript-library.
HighChart chart = new HighChart();
chart.setHeight("500px");
chart.setSizeFull();
String options = ".........";
// x + n lines of creating random json string removed
// see the github if really interested :D
chart.setHcjs("var options = " + options + ";");

return chart;
The results are very good looking. In fact they look almost exactly like the previous one! What kind of trickery is this? The thing is that Vaadin Charts uses Highcharts under the hood.

- License:
- commercial or Creative Commons (CC) Attribution-NonCommercial licence for non-profit usage
- Pricing:
-
$410 / developer
Or
Free for non-profit usage - Pretty-factor:
- 5/5
- Ease of use:
- 2/5 (no Java -methods to use)
- Diversity:
- 5/5, tons of different charts + the combinations so there’s something for almost any scenario
- Customizability:
- 4/5 Using own styles is a breeze and callbacks to different actions give full strength on user experience. The customizability itself is same as in Vaadin Charts (or actually the other way around), but for pure Java-developers, it is not the easiest graph library to implement.
- Link(s):
- https://vaadin.com/directory#!addon/highcharts-for-vaadin-7 and http://www.highcharts.com/docs
Case 3 - JFreeChart
JFreeChart Wrapper is an add-on in Vaadin Directory. It makes it possible to use JFreeChart in Vaadin applications. The library is rather old and it draws images (svg) instead of using javascript for awesome user experience. The default looks are bearable in terms of look ‘n’ feel and even though the library itself is free (LGPL), the documentation costs. At the end of the day, using it was surprisingly easy:
// Create dataset
DefaultCategoryDataset dataset = new DefaultCategoryDataset();
data.forEach((key, stringNumberHashMap) -> {
   stringNumberHashMap.forEach((subkey, number) -> {
       dataset.addValue(number, key, subkey);
   });
});
// Make basic bar chart
JFreeChart chart = ChartFactory.createBarChart(
       Title,
       xTtitle,
       yTitle,
       dataset,
       PlotOrientation.VERTICAL,
       true,
       true,
       false
);

// wrap it
JFreeChartWrapper ret = new JFreeChartWrapper(chart);
ret.setSizeFull();
But the results are not competing with modern libraries. And as said: it’s just an image so no on-hover magic or any other user experience on the chart image itself.

- License:
- LGPL
- Pricing:
- Free (documentation costs, though)
- Pretty-factor:
- 2/5 (old technology, so no eye candy, but works)
- Ease of use:
- 3/5 (very easy to use, but lacking documentation makes it a bit harder)
- Diversity:
- 3/5, basic charts are covered, but nothing fancy
- Customizability:
- 3/5 First of all, the documentation (that must be purchased) would come in handy in case of customizing, and it’s just graphics so you can’t apply css-magic here. But on the other hand, it’s actually just drawing (svg) with Java, so a Java developer could make it sing and dance to her liking :)
- Link(s):
- https://vaadin.com/directory#!addon/jfreechart-wrapper-for-vaadin and http://www.jfree.org/jfreechart/
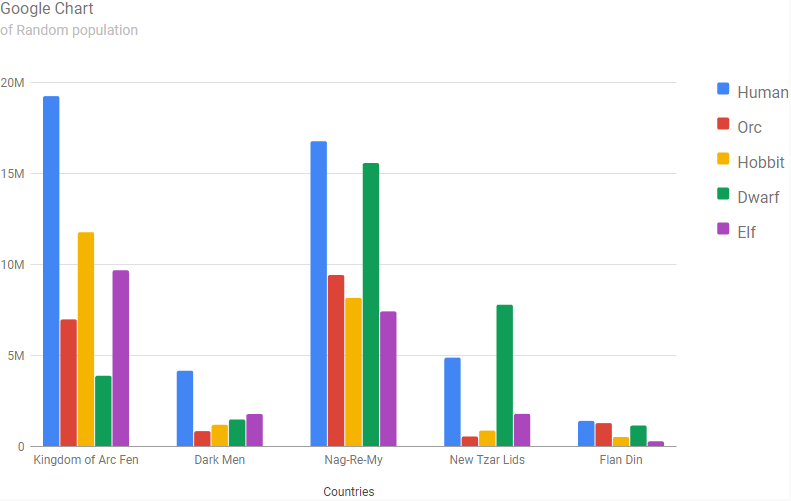
Case 4 - Google Charts
And of course, Google also provides charts. And they are totally free to use but there is a caveat: the charts are rendered on Google’s servers so your data will be going to their servers. Google has developed a powerful API for JavaScript to use the charts. The only problem is that there’s no add-on for it in Vaadin Directory. To tackle it, we made a simple BarChart -widget:
@JavaScript({ "https://www.gstatic.com/charts/loader.js", "BarChart.js" })
public class BarChart extends AbstractJavaScriptComponent {
   private static int elementId = 0;

   private String myId;

   public BarChart(String title, String subtitle) {
       myId = "gBarChartComponent" + (++elementId);
       callFunction("setId", myId);
       setSizeFull();
       setHeight("500px");
       setId(myId);
       getState().myId = myId;
       getState().title = title;
       getState().subTitle = subtitle;
   }
// and so on… please see full code from github
And its counterpart in javascript:
function org_vaadin_sample_gchart_BarChart() {
   var connector;
   var loaded = false;

   function init() {
       google.charts.load('current', {'packages':['bar']});
       google.charts.setOnLoadCallback(this.ready);
   }

   this.ready = function() {
       connector.loaded = true;
       connector.draw();
   }

   this.doDraw = function() {
       // no direct draws:
       // need to check that charts are loaded before
       if (connector.loaded) {
       // and so on… please see full code from github if like
After the widget was done the usage is easy :)
// Make custom-made google bar chart BarChart chart = new BarChart(Title, subTitle); // Add headers ArrayListbarHeaders = new ArrayList<>(); barHeaders.add(xTtitle); for (String c : categories) { barHeaders.add(c); } chart.addHeaders(barHeaders); // add data data.forEach((s, stringNumberHashMap) -> { ArrayList valueData = new ArrayList<>(); valueData.add(s); stringNumberHashMap.forEach((s1, number) -> { valueData.add(number.toString()); }); chart.addValues(valueData); }); chart.drawChart();
And in the end it looks pretty:
- License:
- Free
- Pricing:
- Free (but note: you send your data to Google’s servers)
- Pretty-factor:
- 4/5
- Ease of use:
- 2/5
- Diversity:
-
4/5 + 1 google bonus point. Lots of different charts, but still the number and look-and-feel pales to the Highchart / Vaadin. But then again, Google can deliver something that no-one else can: Geo-Charts and other map-related stuff. Really, take a look, that’s magic:
https://developers.google.com/chart/interactive/docs/gallery/geochart - Customizability:
- 4/5 as long as your js and css -Kung-fu is in place, you can do a lot.
- Link(s):
- https://developers.google.com/chart/
Extra: The js-side itself is very nice and easy. There’s also an option to just prefix the charts and give an URL where to leach the data so we could just implement a simple rest -service to give data and leave the chart building totally to the client side.
Results
It’s - of course - a matter of opinion, but for me, the commercial product Vaadin Charts wins the bet. For free libraries, Google Chart is great. Sure it needs work if you want to have a proper Java API, but it’s also rather straightforward, as long as you’re OK with sending your data to Google’s servers for rendering.
All of the charts examples are also available on GitHub:
https://github.com/mikotin/different-charts
Post scriptum
This list is not a complete set of charts. We skipped some great add-ons, such as:
https://vaadin.com/directory#!addon/chartjs-add-on a Chart.js add-on with Java-api. The results are great, there's fluent Java API and the Chart.js is open source and available under MIT license. Unfortunately, it wasn't supported in Vaadin 8 when the tests were made, but now it is! Please go and give it a try.