
Blog post by Matti Tahvonen:
Like most new chart libraries of our era, Vaadin Charts was born for the web. Behind the scenes, we rely on the industry leading Highcharts JS library, which renders charts in the browser using the standard SVG vector format. Even though SVG had a rocky start, modern browsers nowadays offer great support for the format. IE8 is the last pain in the butt, but luckily Highcharts does a great job rendering charts in Microsoft’s proprietary VML format as well.
The real value of Vaadin Charts comes from its clean Java API. Using the API, it builds a compact JSON representation of a chart, which is then passed to the browser and Highcharts for rendering. Due to the Java API, the integrated documentation, and a modern IDE, all Java developers will feel comfortable with Vaadin Charts from the very beginning.
Basic usage of the API is so simple that I see no point in boring you with usage examples. Download Vaadin Charts, check out the examples and play with it in your favourite IDE. That’s the best way to get convinced!
Instead of basic examples, I want to answer one of the most common questions from evaluators: "Can I use the same chart in a PDF file I need to generate due to accounting legislation?" As you might guess, the answer is yes. And it has got nothing to do with those naive "print" and "download as" buttons you have spotted elsewhere.
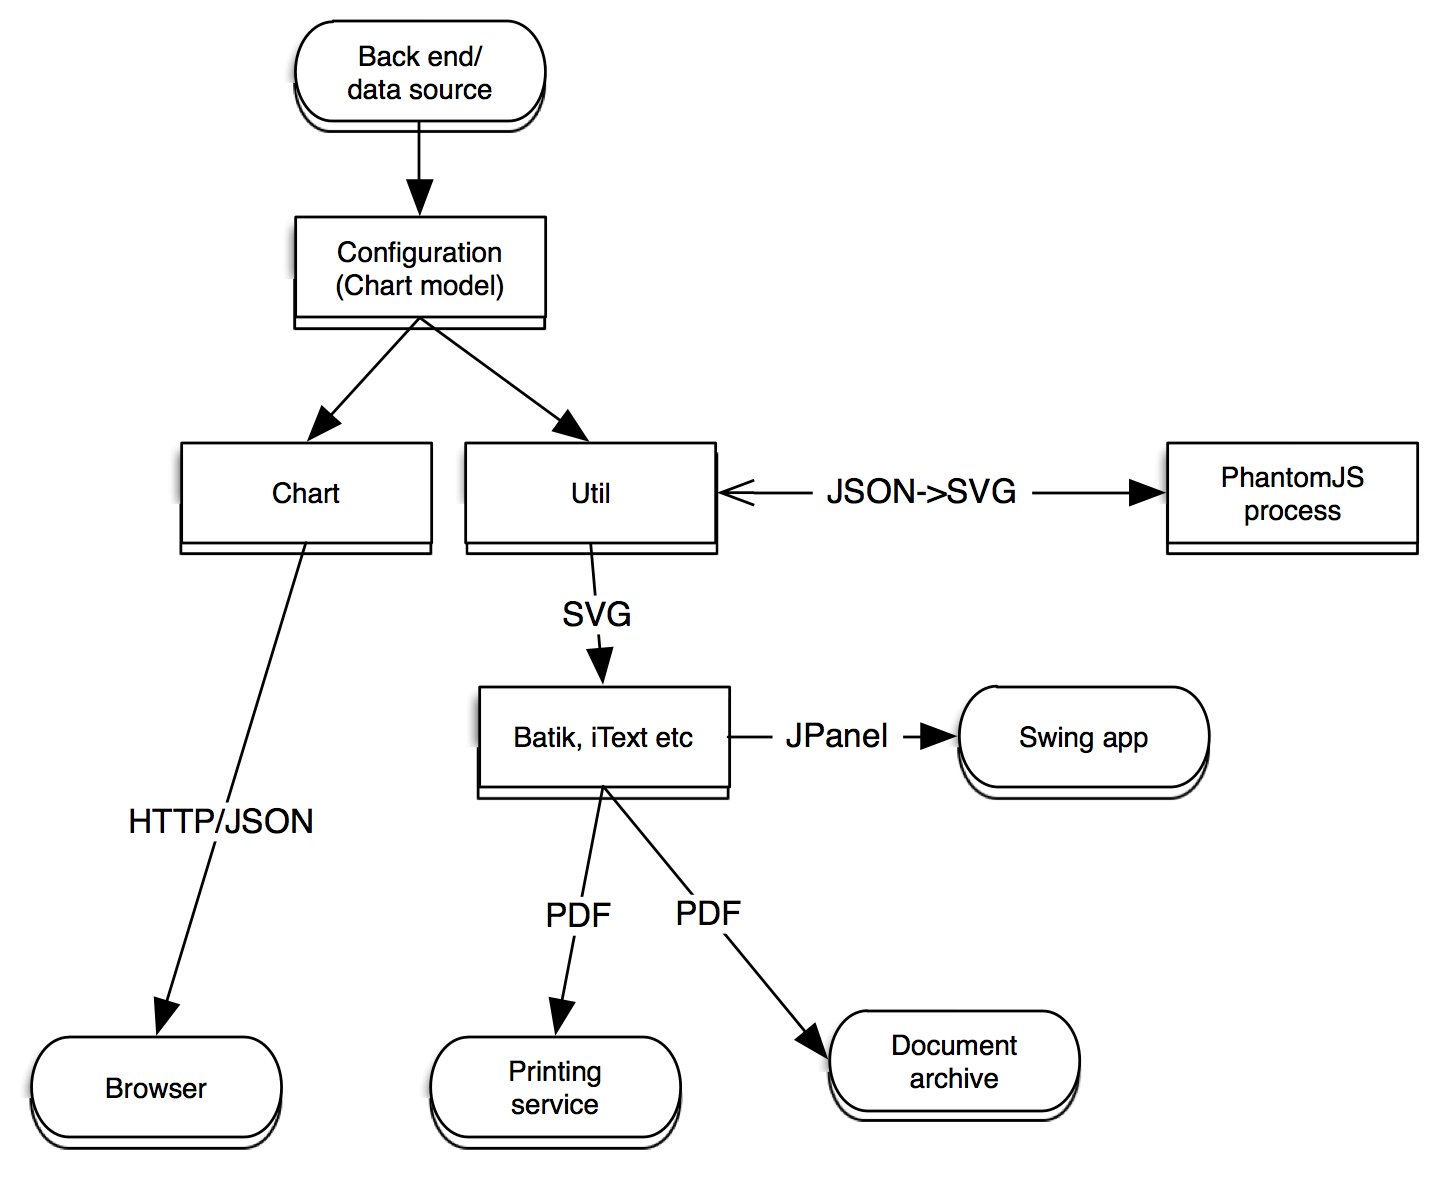
Although the actual rendering of charts happens on the client side using browser technologies, there are tools that let us generate the very same SVG completely on the server side. PhantomJS is a lightweight headless browser, based on the WebKit rendering engine. It is most commonly used for testing purposes. Once you have installed PhantomJS, you can use a helper class in Vaadin Charts to generate an SVG representation of your chart. After that, there is no limit to the possibilities of creative Java developers.
You can generate an SVG from the same Configuration object that you use in your browser UI like this:
String svg = SVGGenerator.getInstance().generate(configuration);
The helper class automatically starts a PhantomJS process that it uses to render charts into SVG format. The first pass takes about a second, but subsequent requests take just around 20ms on my development machine.
Once you have the chart in SVG format, you can do pretty much anything you want with it. If the raw SVG format is not suitable for your needs, Batik is a great Java library to hook it up to your processes.
To demonstrate the feature, we have prepared a simple example project that you can check out from our SVN repository and play with. It displays a chart in a Vaadin UI, which can then be exported into various formats. The server side generated SVG can be downloaded as such or as a part of a PDF report generated with the iText library. To emphasize the agility of Vaadin Charts, there is also an example that opens a Swing UI (JPanel) displaying the SVG on the server. Now you can start porting your legacy Swing app to Vaadin starting with the charts :-)
Related Links:
The example project that uses an exported chart in a Swing app, as a downloadable SVG, and embedded in a PDF.
PhantomJS - The tool that needs to be installed for server side usage.
Batik Toolkit - A general purpose SVG library for Java.

Matti Tahvonen works at the Vaadin team building products like the Vaadin Charts. If you want to meet Matti and ask more about Vaadin Charts join us for a webinar on March 12.