
Great news for all Pro Account users! Vaadin Charts has reached the 1.0 and is now available for download from the Directory.
 Pie, bar, scatter, stacked, timeline, ...
Vaadin Charts has all the features you need to build cool reporting user interfaces to your application. You have seen this in the Quicktickets Dashboard, the Vaadin 7 demo application, but you can find samples of virtually all charts you can imagine in the Charts demo application - with the source code, of course.
Good looking and interactive charts are the primary thing. In addition to these we have a good set of important features:
- High quality vector printing (SVG)
- Reusing charts on the server-side, for example in PDF reports
- Adding your own custom chart types
We will cover some of these features in the upcoming technical blog posts and developer webinar.
Trying it out now
If you like to test and use Vaadin Charts right now, just log in to vaadin.com and go to vaadin.com/charts, click the download link and either download the zip file or follow the Maven instructions. You can try it out for 30 days for free and purchase later either with Pro Account or a separate license.
You can find the full documentation in the Book of Vaadin, but using the charts in your application is as easy as using any Vaadin add-on component. After installing the jar, all you need to do is write the Java code. Here is a small sample of plotting the memory usage of the server the app is running on.
// Create a chart configuration
Configuration conf = new Configuration();
conf.setTitle("Server Memory Use");

// Configure Y axis
YAxis memAxis = new YAxis();
memAxis.setTitle("Memory use (in bytes)");
conf.addyAxis(memAxis);

// Configure and add chart to a layout
Chart chart = new Chart();
chart.setConfiguration(conf);
layout.addComponent(chart);

// Initialize data series for content
DataSeries mem = new DataSeries();
mem.setPlotOptions(new PlotOptionsSpline());
mem.setyAxis(0);
conf.addSeries(mem);

// Add a data point (long values will do)
Runtime r = Runtime.getRuntime();
mem.add(new DataSeriesItem(System.currentTimeMillis(), r.totalMemory()
		- r.freeMemory()));

// Todo: Start a thread to repeat and update the data.
If you want take a look at the full working sample of real time spline charting you can find it here.
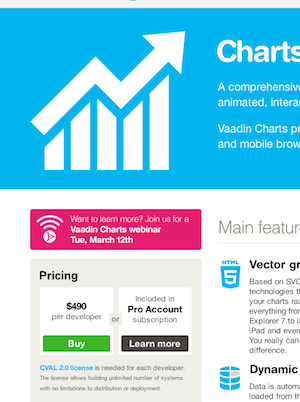
Join us for a Vaadin Charts developer webinar!
To help you learn more about Vaadin Charts, we invite you to join us for a special developer webinar on Tuesday March 12. We want to give you a demo and some getting started pointers as well as hear what you might have in mind. So, if you have any questions about Vaadin Charts, the guys behind the product, Sami Kaksonen and Matti Tahvonen are there to chat with you. The webinar is free for everyone, so enroll now!