In the series of new features in 7.1.0, last week we looked into how the push functionality works, and this time we’re taking a bit more shallow and visual approach. I’ll walk us through the completely new and redesigned debug window. Aside from the fact that it’s actually easy on the eyes nowadays, there’s a few API changes for the developers that make our lives easier.
Debug message log
First off the most important part: If a Vaadin application is not in production mode, you can add a “debug” get parameter (e.g. http://demo.vaadin.com/pushblog/?debug). This will bring up the debug console, and you’ll see something like this as of Vaadin 7.1:
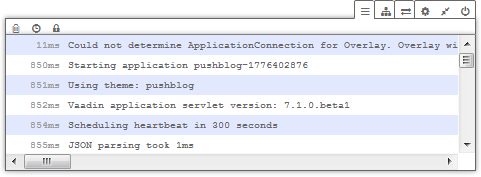
As an improvement from earlier Vaadin versions, as you can see, each button has a neat icon, and each icon’s meaning can be seen by hovering your cursor, as you’ll be presented a tooltip. The logs are properly indented, and it’s very easy to read what’s in the logs. While I chose the smallest font size for this image, you have three font sizes to choose from.
This first tab is where the raw debug data is dumped as strings, with a timestamp that starts from the initial rendering of the application. You can reset the timer by clicking the clock icon on the top left corner. The third icon is a scroll lock - the console will scroll down by default, toggling this option will let you control that behavior.
Examine component hierarchy
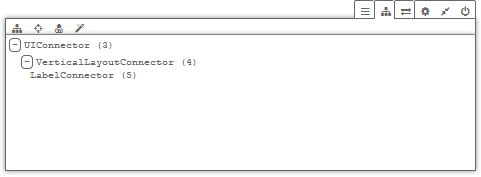
Moving on to the next tab, called “Examine component hierarchy”, we get to yet another feature that has been prettified from the previous versions, grouped into its own neat tab. Clicking the first icon on the top right will analyze the layouts, and output the connector hierarchy as initialized in Vaadin. (Protip: if you double click on a connector’s name in that list, you’ll get a data dump for that connector.) You also have the “inspect component” and “analyze layout” tools. But the last one is a new one that’s great for optimizing your completed application.
The debug window will keep tabs on each component that your application uses. Therefore, it can suggest an optimal widgetset for your application - one that will compile and load only the components that your application uses, and only those. This will lead to reduced load times since less data needs to be downloaded for the widgetset, and less javascript needs to be parsed and compiled by the browser. Just remember to update your widgetset as you add new components in your application.
Communication
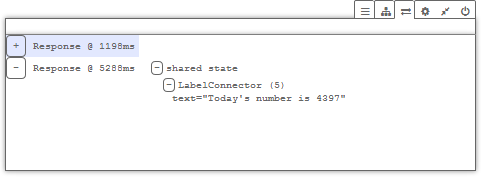
The communication tab shows the contents of each response the browser receives from the server side. That is to say, all changes made to components, their attributes, rpc calls, state changes etc, you can see in clear text here.
The rest
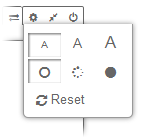 Lastly we have some other nice things put away in places where they belong: pressing the cog icon, you’ll get to choose font size for your debug window and put your application into DevMode or SuperDevMode. And you’re able to reset the settings to their default values, too.
Lastly, you have a minimize button, that makes the debug window a tiny little box in the lower left corner of your screen, or you can close the window altogether (you get it back by reloading the page with the “debug“ parameter).
Stuff for widget developers
Not only is the debug window looking (and arguably functioning) better than ever, we also have removed some unnecessary API. If you wanted to get some data logged into the Vaadin console, you needed to call either of VConsole.log or VConsole.error methods, which is less than great if you want to log something from your widget, still keeping the widget side as Vaadin-agnostic as possible.
Well, we’ve changed that. You don’t need to import Vaadin packages anymore to have Vaadin-supported logging. Now the debug window will listen to all the familiar logging methods that GWT has used for ages. Using the java.util.logging.Logger works as usual in GWT, in addition to being shown in Vaadin’s debug window. You can read more about GWT logging in the documentation.