Designing Charts Declaratively
- Introduction
- Java Implementation
- Separation to Configuration and Data series
- Charts Declarative Syntax
- Complete Example
- How to Use It?
- Writing the Declarative format
Introduction
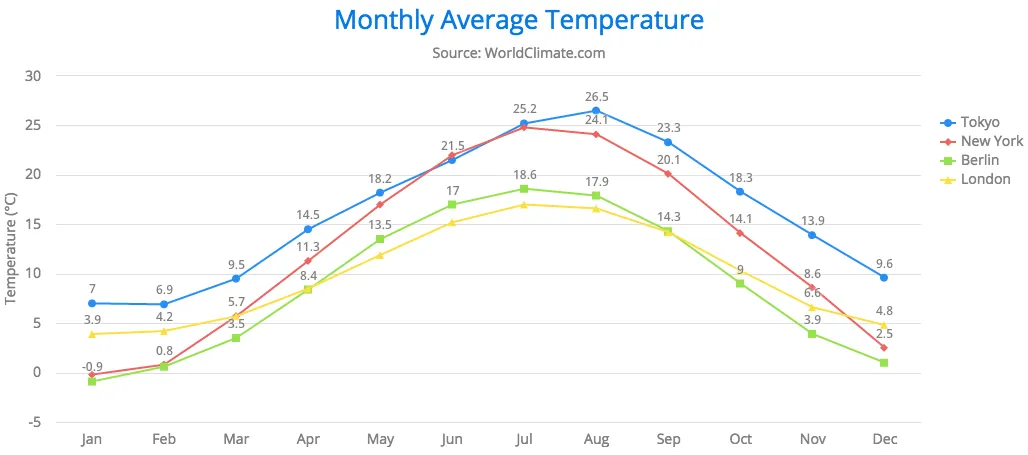
Vaadin UIs can be defined in a declarative way, as described in "Designing UIs Declaratively". Vaadin Charts also supports this format. In this tutorial, we go through how the Basic Line example in the Vaadin Charts demo can be implemented using the declarative format. The result is shown in Basic line example.
Java Implementation
Let us first consider a Java implementation of the example. After creating the Chart object, you can configure it by using a Configuration object. The configuration object itself contains various kinds of objects which can be used to configure different parts of the chart. For example, Legend is used for configuring the chart legend. The following code has been commented to indicate what kinds of configuration objects it uses.
Source code
Java
// Chart
Chart chart = new Chart();
chart.setHeight("450px");
chart.setWidth("100%");

// Chart configuration
Configuration configuration = chart.getConfiguration();
configuration.getChart().setType(ChartType.LINE);
configuration.getChart().setMarginRight(130);
configuration.getChart().setMarginBottom(25);

// Title and tooltip configuration
configuration.getTitle().setText("Monthly Average Temperature");
configuration.getSubTitle().setText("Source: WorldClimate.com");
configuration.getTooltip()
        .setFormatter(
                "'<b>'+ this.series.name +'</b><br/>'+this.x +': '+ this.y +'°C'");

// Axis configuration
configuration.getxAxis().setCategories("Jan", "Feb", "Mar", "Apr",
        "May", "Jun", "Jul", "Aug", "Sep", "Oct", "Nov", "Dec");
YAxis yAxis = configuration.getyAxis();
yAxis.setMin(-5d);
yAxis.setTitle(new AxisTitle("Temperature (°C)"));
yAxis.getTitle().setAlign(VerticalAlign.MIDDLE);

// Plot options
PlotOptionsLine plotOptions = new PlotOptionsLine();
plotOptions.setDataLabels(new DataLabels(true));
configuration.setPlotOptions(plotOptions);

// Legend configuration
Legend legend = configuration.getLegend();
legend.setLayout(LayoutDirection.VERTICAL);
legend.setAlign(HorizontalAlign.RIGHT);
legend.setVerticalAlign(VerticalAlign.TOP);
legend.setX(-10d);
legend.setY(100d);
legend.setBorderWidth(0);

// Create data
ListSeries ls = new ListSeries();
ls.setName("Tokyo");
ls.setData(7.0, 6.9, 9.5, 14.5, 18.2, 21.5, 25.2, 26.5, 23.3, 18.3, 13.9, 9.6);
myChart.getConfiguration().addSeries(ls);
ls = new ListSeries();
...
myChart.getConfiguration().addSeries(ls);
Separation to Configuration and Data series
When the declarative format is used, the chart is configured declaratively in an HTML file.
Java code is needed for some tasks, such as for handling events and data binding.
It can be used to provide any dynamic configuration, such as to populate the chart with dynamic data.
The _id attribute is used to map the design to a Java object, as described in "Component Identifiers".
The first element in the HTML should be the same type as the design root, as described in "Binding to a Design Root".
In the following example, vaadin-vertical-layout is used as the first element, so the design root must extend the corresponding VerticalLayout class.
Also, the :expand attribute is a parent setting of the vaadin-vertical-layout element, as described in "Parent Component Settings".
The Java example presented earlier could then be separated into HTML design and Java code. The HTML design would be as follows:
Source code
HTML
<!DOCTYPE html>
<html>
<body>
<vaadin-vertical-layout size-full>
    <vaadin-line-chart _id="mychart" timeline="false" height="450px" :expand>
        <!-- configuration omitted -->
    </vaadin-line-chart>
</vaadin-vertical-layout>
</body>
</html>
Let us then consider how to use it from Java code. Before using declarative designs that contain charts, you need to configure the design reader for Vaadin Charts. You need to set ChartComponentMapper as the component mapper. Then, call Design.read() to read the design. You also need to define the chart data series in Java.
Source code
Java
// Bind the root component
@DesignRoot(value="basic_line.html")
public class BasicLine extends VerticalLayout {

    Chart myChart;

    public BasicLine() {
        // Configure the declarative design reader to read Vaadin Charts tags
        Design.setComponentMapper(new ChartComponentMapper());

        // Read the HTML file specified in the @DesignRoot annotation
        Design.read(this);

        // Populate the chart with some data
        ListSeries ls = new ListSeries();
        ls.setName("Tokyo");
        ls.setData(7.0, 6.9, 9.5, 14.5, 18.2, 21.5, 25.2, 26.5, 23.3, 18.3,
            13.9, 9.6);
        myChart.getConfiguration().addSeries(ls);
        ls = new ListSeries();
        ...
        myChart.getConfiguration().addSeries(ls);
    }
}
Charts Declarative Syntax
In the Charts design format, each configuration object is defined in its own element and the properties for the object are defined as the attributes of the element. The naming convention of attributes is the same as described in "Component Attributes"
The following elements are reserved in the HTML specification: title, style, area and frame.
These elements should be prefixed by chart- to make parsing behave correctly.
For example, title configuration is specified inside chart-title element.
Another exception is with the on-key and on-series properties. They require draw- prefix.
For example, Legend object could be defined in Java as follows:
Source code
Java
Legend legend = configuration.getLegend();
legend.setLayout(LayoutDirection.VERTICAL);
legend.setAlign(HorizontalAlign.RIGHT);
legend.setVerticalAlign(VerticalAlign.TOP);
legend.setX(-10d);
legend.setY(100d);
legend.setBorderWidth(0);
With the declarative format, the same legend configuration looks as follows:
Source code
HTML
<legend layout="vertical" align="right" vertical-align="top" x="-10"
        y="100" border-width="0"></legend>
If the property is a list, the values are defined in its own element. For example, category labels for the X axis can be defined as follows:
Source code
HTML
<x-axis>
    <categories>Jan, Feb, Mar, Apr, May, Jun, Jul, Aug, Sep, Oct, Nov, Dec</categories>
</x-axis>
In title elements, namely chart-title and subtitle, you can give the title text simply as the inner text of the element.
Source code
HTML
<chart-title>Monthly Average Temperature</chart-title>
<subtitle>Source: WorldClimate.com</subtitle>
If a property is a configuration object itself, it is defined as a child element. For example, the title of the Y axis is defined as follows:
Source code
HTML
<y-axis >
    <chart-title align="middle">Temperature (°C)</chart-title>
</y-axis>
Plot options are defined in a bit different way from other configuration objects. They are given inside a plot-options element. The element must have a child element of the same name as the chart type to which they apply. The plot options are then defined in the inner element. For example, PlotOptionsLine is configured as follows:
Source code
HTML
<plot-options>
    <line>
        <data-labels enabled="true"></data-labels>
    </line>
</plot-options>
Complete Example
When all the configuration objects in the example in "Java Implementation" are defined in the declarative format, the final design will look as follows:
Source code
HTML
<!DOCTYPE html>
<html>
<body>
<vaadin-vertical-layout size-full>
    <vaadin-line-chart _id="mychart" timeline="false" height="450px" :expand>
        <chart margin-right="130" margin-bottom="25"></chart>
        <chart-title>Monthly Average Temperature</chart-title>
        <subtitle>Source: WorldClimate.com</subtitle>
        <legend layout="vertical" align="right" vertical-align="top" x="-10"
                y="100" border-width="0"></legend>
        <y-axis min="-5">
            <chart-title align="middle">Temperature (°C)</chart-title>
        </y-axis>
        <x-axis>
            <categories>Jan, Feb, Mar, Apr, May, Jun,
                        Jul, Aug, Sep, Oct, Nov, Dec</categories>
        </x-axis>
        <tooltip formatter=
            "function() {return '' + this.series.name + ' ' + this.x +
                                ': ' + this.y + '°C';}">
        </tooltip>
        <plot-options>
            <line>
                <data-labels enabled="true"></data-labels>
            </line>
        </plot-options>
    </vaadin-line-chart>
</vaadin-vertical-layout>
</body>
</html>
How to Use It?
Declaratively defined charts can be used like any other declarative design with Vaadin. This is explained in more detail in "Using Designs in Code".
To use the declarative chart example presented earlier, you need to do the following steps:
-
Create a file named basic_line.html with the same content as described in "Complete Example".
-
Add the @DesignRoot annotation to a class that extends VerticalLayout.
Source code
// Bind the root component
@DesignRoot(value="basic_line.html")-
Add a member field
Chart myChartto the same class. -
Set the custom component mapper.
Source code
// Set custom component mapper to read tags <vaadin-type-chart>
Design.setComponentMapper(new ChartComponentMapper());-
Read the design.
Source code
// Read the HTML file specified in the @DesignRoot annotation
Design.read(this);-
Add code to populate
myChartwith data.
Source code
// Populate data
ListSeries ls = new ListSeries();
ls.setName("Tokyo");
ls.setData(7.0, 6.9, 9.5, 14.5, 18.2, 21.5, 25.2, 26.5, 23.3, 18.3, 13.9, 9.6);
myChart.getConfiguration().addSeries(ls);
ls = new ListSeries();
ls.setName("New York");
ls.setData(-0.2, 0.8, 5.7, 11.3, 17.0, 22.0, 24.8, 24.1, 20.1, 14.1, 8.6, 2.5);
myChart.getConfiguration().addSeries(ls);
ls = new ListSeries();
ls.setName("Berlin");
ls.setData(-0.9, 0.6, 3.5, 8.4, 13.5, 17.0, 18.6, 17.9, 14.3, 9.0, 3.9, 1.0);
myChart.getConfiguration().addSeries(ls);
ls = new ListSeries();
ls.setName("London");
ls.setData(3.9, 4.2, 5.7, 8.5, 11.9, 15.2, 17.0, 16.6, 14.2, 10.3, 6.6, 4.8);
myChart.getConfiguration().addSeries(ls);
After these steps, you can deploy your application with the chart. You should see a similar chart as the one shown in Basic line example
Writing the Declarative format
Vaadin Charts is also able to write its current content in the declarative format. To see your chart as a declarative design, you can do the following steps.
-
Open the debug window as described in "Debug window".
-
Select from the tab Examine component hierarchy the sub-tab Generate a declarative design
-
Select the chart in your UI.
-
View the server console log to see the declarative design listing.