Chart Data
Chart data is stored in a data series model that contains information about the visual representation of the data points in addition to their values. There are a number of different types of series - DataSeries, ListSeries, AreaListSeries, and RangeSeries.
List Series
The ListSeries is essentially a helper type that makes the handling of simple sequential data easier than with DataSeries. The data points are assumed to be at a constant interval on the X axis, starting from the value specified with the pointStart property (default is 0) at intervals specified with the pointInterval property (default is 1.0). The two properties are defined in the PlotOptions for the series.
The Y axis values are given as constructor parameters or using the setData() method.
Source code
Java
ListSeries series = new ListSeries(
      "Total Reindeer Population",
      181091, 201485, 188105);
PlotOptionsLine plotOptions = new PlotOptionsLine();
plotOptions.setPointStart(1959);
series.setPlotOptions(plotOptions);
conf.addSeries(series);
You can also add them one by one with the addData() method.
If the chart has multiple Y axes, you can specify the axis for the series by its index number using setyAxis().
Generic Data Series
The DataSeries can represent a sequence of data points at an interval as well as scatter data. Data points are represented with the DataSeriesItem class, which has x and y properties for representing the data value. Each item can be given a category name.
Source code
Java
DataSeries series = new DataSeries();
series.setName("Total Reindeer Population");
series.add(new DataSeriesItem(1959, 181091));
series.add(new DataSeriesItem(1960, 201485));
series.add(new DataSeriesItem(1961, 188105));
series.add(new DataSeriesItem(1962, 177206));

// Modify the color of one point
series.get(2).getMarker().setFillColor(SolidColor.RED);
conf.addSeries(series);
Data points are associated with some visual representation parameters: marker style, selected state, legend index, and dial style (for gauges). Most of them can be configured at the level of individual data series items, the series, or in the overall plot options for the chart. The configuration options are described in "Chart Configuration". Some parameters, such as the sliced option for pie charts is only meaningful to configure at item level.
Adding and Removing Data Items
New DataSeriesItem items are added to a series with the add() method. The basic method takes just the data item, but the other method takes also two boolean parameters. If the updateChart parameter is false, the chart is not updated immediately. This is useful if you are adding many points in the same request.
The shift parameter, when true, causes removal of the first data point in the series in an optimized manner, thereby allowing an animated chart that moves to left as new points are added. This is most meaningful with data with even intervals.
You can remove data points with the remove() method in the series. Removal is generally not animated, unless a data point is added in the same change, as is caused by the shift parameter for the add().
Updating Data Items
If you update the properties of a DataSeriesItem object, you need to call the update() method for the series with the item as the parameter. Changing data in this way causes animation of the change.
Range Data
Range charts expect the Y values to be specified as minimum-maximum value pairs. The DataSeriesItem provides setLow() and setHigh() methods to set the minimum and maximum values of a data point, as well as a number of constructors that accept the values.
Source code
Java
RangeSeries series =
    new RangeSeries("Temperature Extremes");

// Give low-high values in constructor
series.add(new DataSeriesItem(0, -51.5, 10.9));
series.add(new DataSeriesItem(1, -49.0, 11.8));

// Set low-high values with setters
DataSeriesItem point = new DataSeriesItem();
point.setX(2);
point.setLow(-44.3);
point.setHigh(17.5);
series.add(point);
The RangeSeries offers a slightly simplified way of adding ranged data points, as described in Range Series.
Range Series
The RangeSeries is a helper class that extends DataSeries to allow specifying interval data a bit easier, with a list of minimum-maximum value ranges in the Y axis. You can use the series in range charts, as described in "Area and Column Range Charts".
For the X axis, the coordinates are generated at fixed intervals starting from the value specified with the pointStart property (default is 0) at intervals specified with the pointInterval property (default is 1.0).
Setting the Data
The data in a RangeSeries is given as an array of minimum-maximum value pairs for the Y value axis. The pairs are also represented as arrays. You can pass the data using the ellipsis in the constructor or using setData():
Source code
Java
RangeSeries series =
    new RangeSeries("Temperature Ranges",
    new Double[]{-51.5,10.9},
    new Double[]{-49.0,11.8},
    ...
    new Double[]{-47.0,10.8});
conf.addSeries(series);
Data Provider Series
DataProviderSeries is an adapter for using a Vaadin DataProvider as a DataSeries in a chart. Using setPointName(), setX(), and setY() you can define which parts of the bean in the DataProvider are used in the chart.
|
Note
| DataProviderSeries is based on the data model in Vaadin Framework 8. It replaces ContainerDataSeries, which allowed binding to a Container data model in Vaadin Framework 7. |
Let us consider an example, where we have a DataProvider which provides items of type Order.
The Order class has getDescription(), getUnitPrice(), and getQuantity() to be used for the chart:
Source code
Java
public class Order {
    private String description;
    private int quantity;
    private double unitPrice;

    public Order(String description, int quantity, double unitPrice) {
        this.description = description;
        this.quantity = quantity;
        this.unitPrice = unitPrice;
    }

    public String getDescription() {
        return description;
    }

    public int getQuantity() {
        return quantity;
    }

    public double getUnitPrice() {
        return unitPrice;
    }

    public double getTotalPrice() {
        return unitPrice * quantity;
    }
}
If we have a data provider containing a list of Order instances:
Source code
Java
// The data
List<Order> orders = new ArrayList<>();
orders.add(new Order("Domain Name", 3, 7.99));
orders.add(new Order("SSL Certificate", 1, 119.00));
orders.add(new Order("Web Hosting", 1, 19.95));
orders.add(new Order("Email Box", 20, 0.15));
orders.add(new Order("E-Commerce Setup", 1, 25.00));
orders.add(new Order("Technical Support", 1, 50.00));
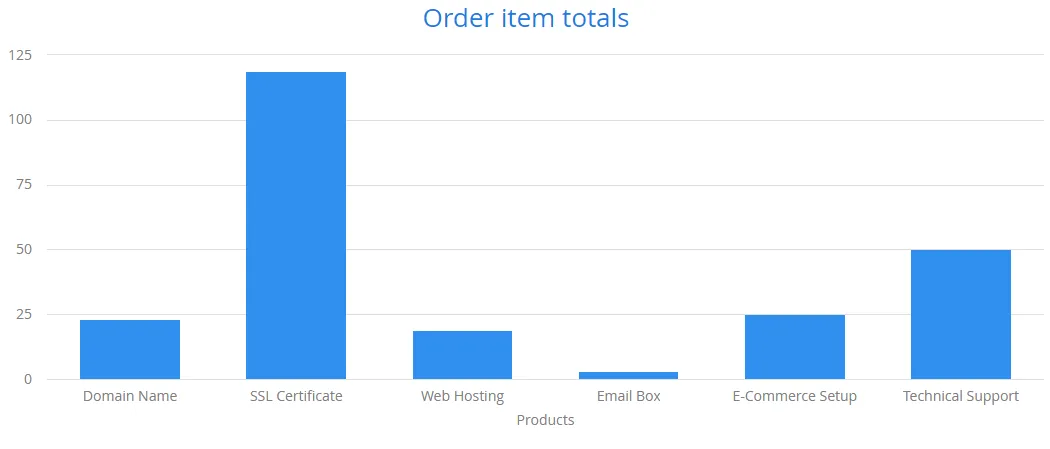
DataProvider<Order, ?> dataProvider = new ListDataProvider<>(orders);We can display the data in a Chart as follows:
Source code
Java
// Create a chart and use the data provider
Chart chart = new Chart(ChartType.COLUMN);
Configuration configuration = chart.getConfiguration();
DataProviderSeries<Order> series = new DataProviderSeries<>(dataProvider, Order::getTotalPrice);
configuration.addSeries(series);|
Note
|
The DataProviderSeries constructor takes the y value provider as an optional argument. It can also be set using setY.
|
To make the chart look nicer, we can add a name for the series and show the order description when hovering points:
Source code
Java
series.setName("Order item quantities");
series.setX(Order::getDescription);
To show the description also as x axis labels, we need to set the x axis type to category as the labels are strings:
Source code
Java
configuration.getxAxis().setType(AxisType.CATEGORY);The result, with some added titles, is shown in Chart Bound to a DataProvider.
|
Note
| Dynamic changes to the data will be loaded in the data series after calling the refreshAll() method in the DataProvider. This behavior can be disabled by setting the automaticChartUpdateEnabled property to false in DataProviderSeries. |
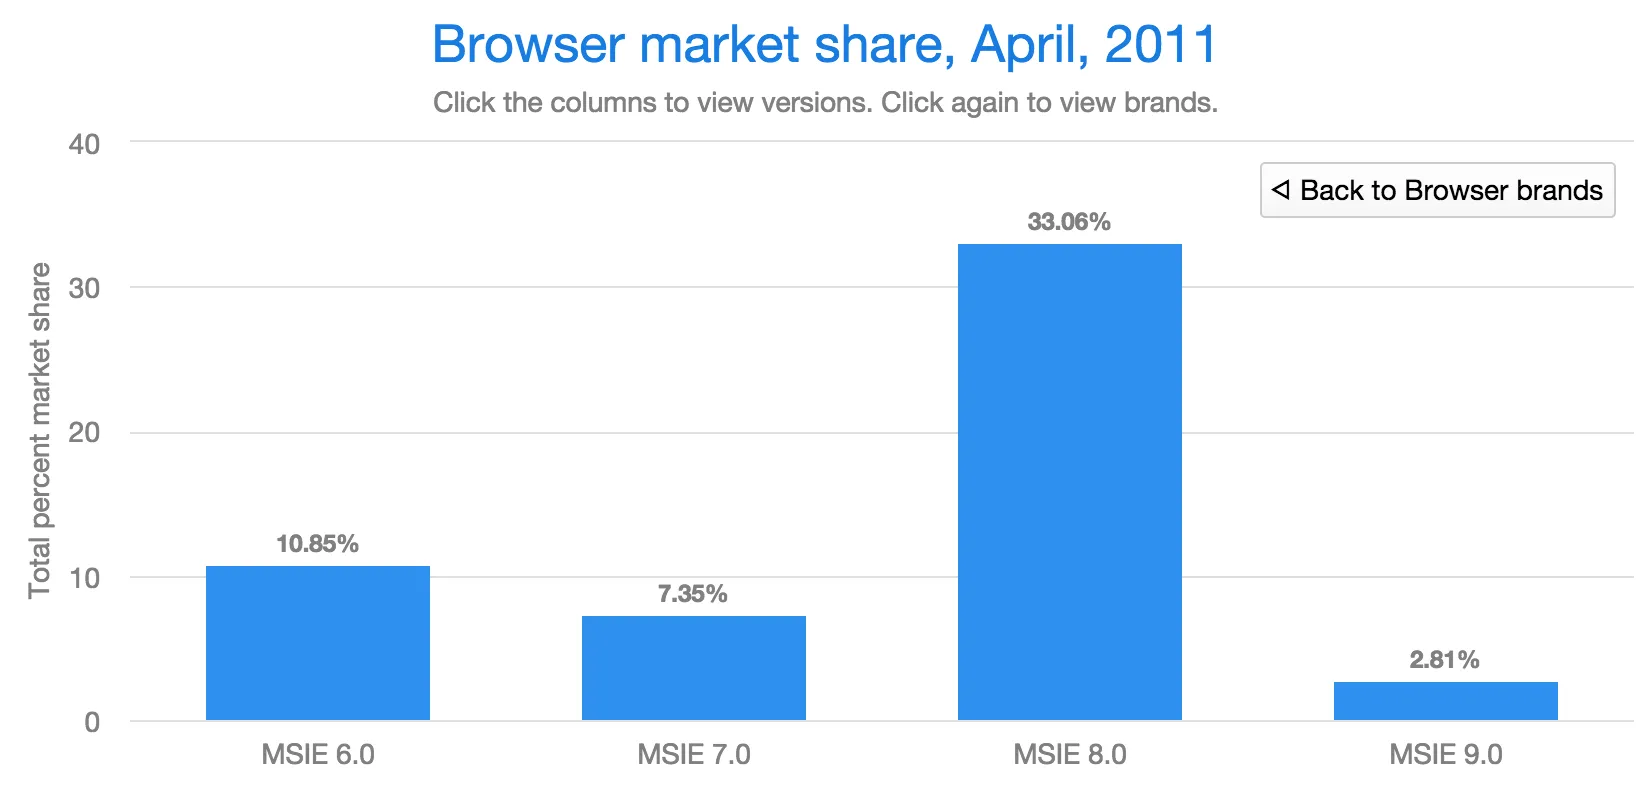
Drill-Down
Vaadin Charts allows drilling down from a chart to a more detailed view by clicking an item in the top-level view. To enable the feature, you need to provide a separate data series for each of the detailed views by calling the addItemWithDrilldown() method. When the user clicks on a drill-down item, the current series is animated into the the linked drill-down series. A customizable back button is provided to navigate back to the main series, as shown in Detailed series after a drill-down.
There are two ways to use drill-down: synchronous and asynchronous.
Synchronous
When using synchronous drill-down, you provide the top-level series and all the series below it beforehand. The data is transferred to the client-side at the same time and no client-server communication needs to happen for the drill-down. The drill-down series must have an identifier, set with setId(), as shown below.
Source code
Java
DataSeries series = new DataSeries();

DataSeriesItem mainItem = new DataSeriesItem("MSIE", 55.11);

DataSeries drillDownSeries = new DataSeries("MSIE versions");
drillDownSeries.setId("MSIE");

drillDownSeries.add(new DataSeriesItem("MSIE 6.0", 10.85));
drillDownSeries.add(new DataSeriesItem("MSIE 7.0", 7.35));
drillDownSeries.add(new DataSeriesItem("MSIE 8.0", 33.06));
drillDownSeries.add(new DataSeriesItem("MSIE 9.0", 2.81));

series.addItemWithDrilldown(mainItem, drillDownSeries);
Asynchronous
When using asynchronous drill-down, you omit the drill-down series parameter. Instead, you provide a callback method with Chart.setDrillDownCallback(). When the user clicks an item in the series, the callback is called to provide a drill-down series.
Source code
Java
DataSeries series = new DataSeries();

DataSeriesItem mainItem = new DataSeriesItem("MSIE", 55.11);

series.addItemWithDrilldown(mainItem);

chart.setDrilldownCallback(new DrilldownCallback() {
    @Override
    public Series handleDrilldown(DrilldownEvent event) {
        DataSeries drillDownSeries = new DataSeries("MSIE versions");

        drillDownSeries.add(new DataSeriesItem("MSIE 6.0", 10.85));
        drillDownSeries.add(new DataSeriesItem("MSIE 7.0", 7.35));
        drillDownSeries.add(new DataSeriesItem("MSIE 8.0", 33.06));
        drillDownSeries.add(new DataSeriesItem("MSIE 9.0", 2.81));

        return drillDownSeries;
    }
});
You can use the event to decide what kind of series you want to return. The event contains, for example, a reference to the item that was clicked. Note that the same callback is used for all items. The callback can also return null, which will prevent a drilldown.