Charts
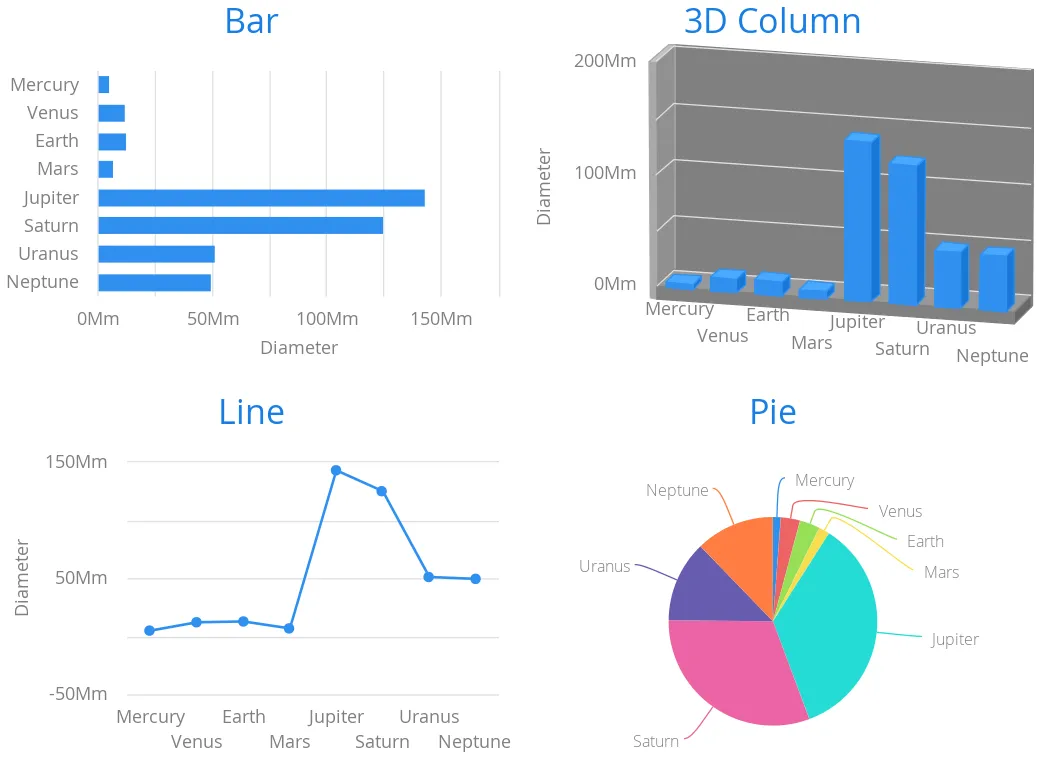
Vaadin Charts is a feature-rich interactive charting library for Vaadin. It provides multiple different chart types for visualizing one- or two-dimensional tabular data, or scatter data with free X and Y values. You can configure all the chart elements with a powerful API as well as the visual style using CSS. The built-in functionalities allow the user to interact with the chart elements in various ways, and you can define custom interaction with events.
Licensing
Vaadin Charts is a commercial product licensed under the CVAL License (Commercial Vaadin Add-On License). You need to install a license key in order to develop your application with Vaadin Charts.
You can purchase Vaadin Charts or obtain a free trial key from the license section in Vaadin website. You need to be a registered user to obtain the key.
98D810AA-DAC9-45F6-8345-816BDD3CF9A9