CSS Styling
- Steps for styling a chart
- Example 1: Chart with Yellow Point Markers and Red Labels
- Example 2: Exposing a Chart element in Java for CSS Styling
Chart appearance is primarily controlled by CSS style rules. A comprehensive list of the supported style classes can be found here.
Steps for styling a chart
Starting from Vaadin 14, applications running on the default mode can use @CssImport annotation that allows theme creation with plain CSS files. See the "Migrating Theming Files from Polymer 2 to Polymer 3" page for more details.
-
Create a CSS file (by convention this should be at
frontend/styles/). -
Specify the desired CSS rules in the theme file.
-
If multiple charts are present, each one can be specifically targeted by the host selector e.g
:host(.first-chart-class). -
Add the annotation to import the style (
@CssImport(value = "./styles/my-charts-styles.css", themeFor = "vaadin-chart", include = "vaadin-chart-default-theme")).NoteIf there are multiple theme modules only one of them should declare the includein step 4 above.
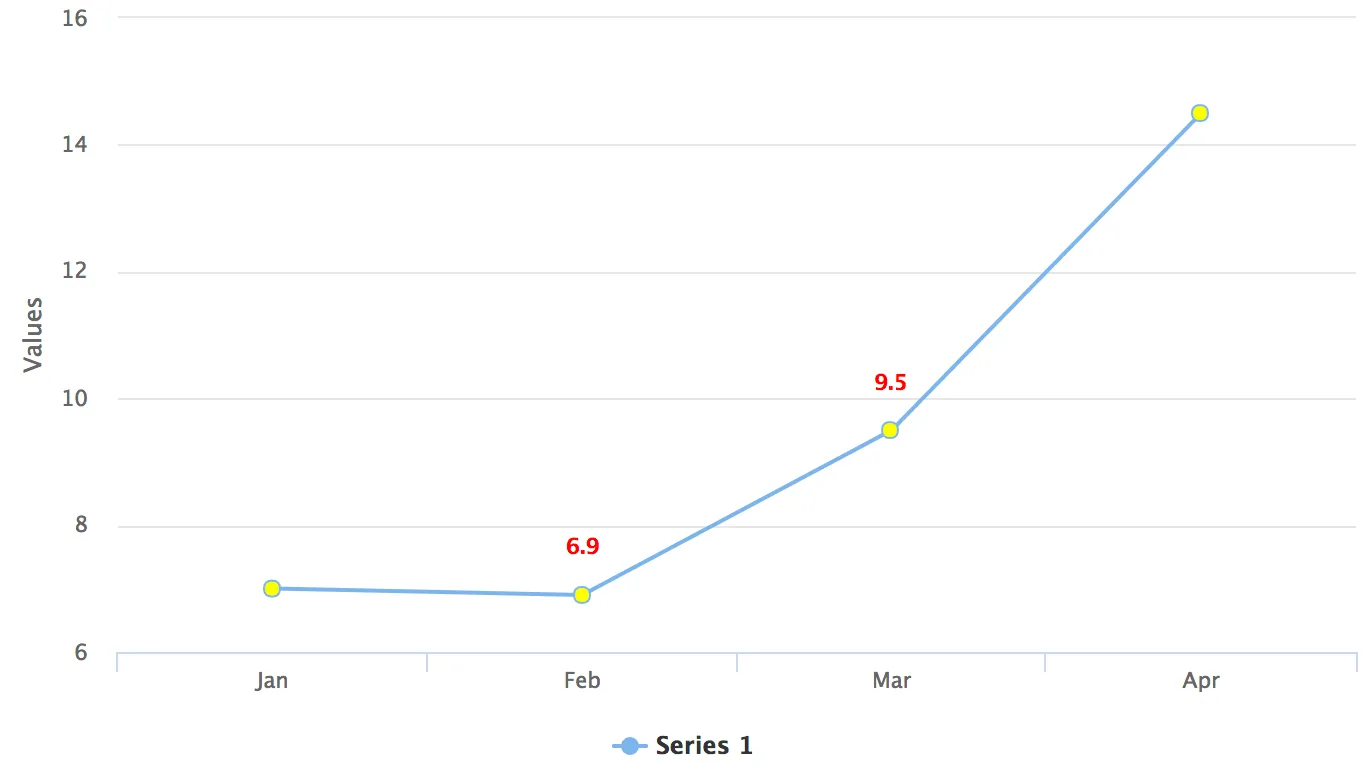
Example 1: Chart with Yellow Point Markers and Red Labels
custom-chart-styles.css
Source code
CSS
:host(.first-chart) g.highcharts-markers > .highcharts-point {
  fill: yellow;
}

:host(.first-chart) .highcharts-data-label text {
  fill: red;
}
CssStyleExample.java
Source code
Java
@CssImport(value = "./styles/custom-chart-styles.css", themeFor = "vaadin-chart", include = "vaadin-chart-default-theme")
public class CssStyleExample extends Div {

    public CssStyleExample() {
        Chart chart = new Chart();
        Configuration configuration = chart.getConfiguration();

        configuration.getChart().setType(ChartType.LINE);

        configuration.getxAxis().setCategories("Jan", "Feb", "Mar", "Apr");

        DataSeries ds = new DataSeries();
        ds.setData(7.0, 6.9, 9.5, 14.5);

        DataLabels callout = new DataLabels(true);
        callout.setShape(Shape.CALLOUT);
        callout.setY(-12);
        ds.get(1).setDataLabels(callout);
        ds.get(2).setDataLabels(callout);
        configuration.addSeries(ds);

        chart.addClassName("first-chart");
        add(chart);
    }
}
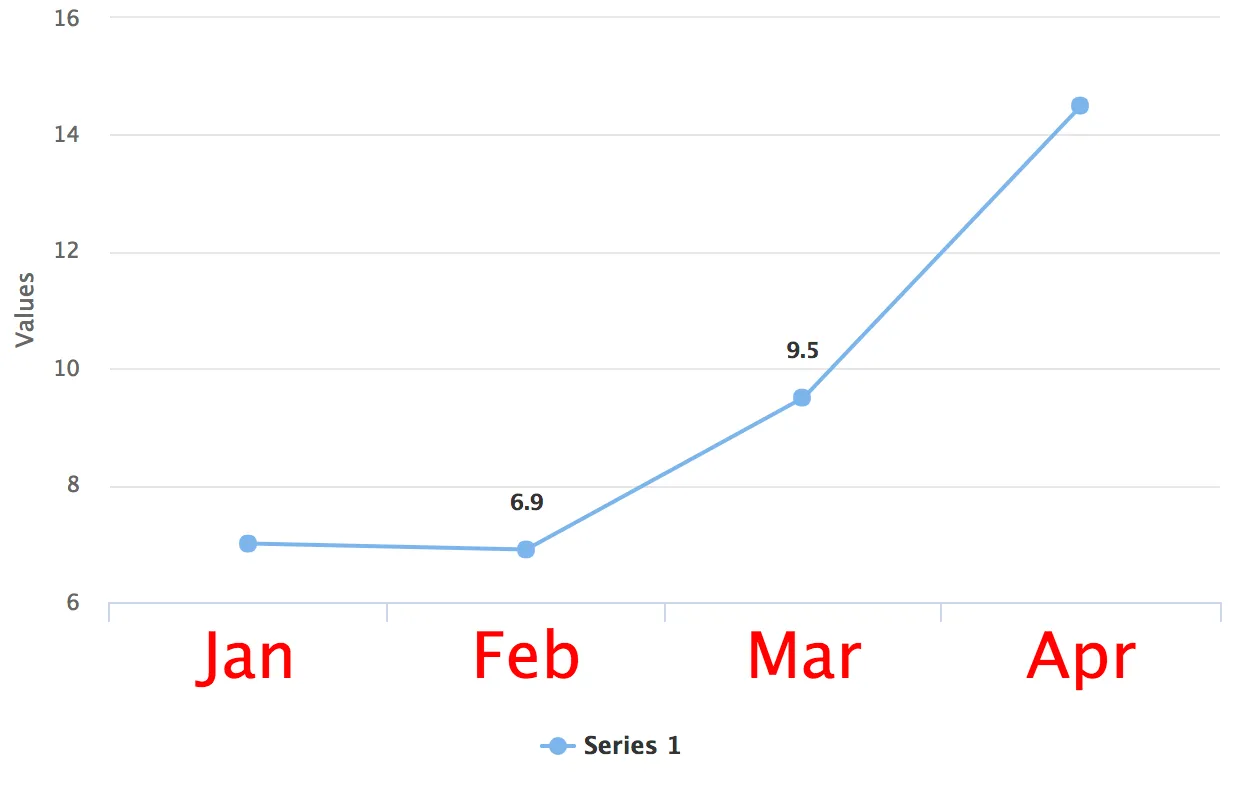
Example 2: Exposing a Chart element in Java for CSS Styling
huge-axis.css
Source code
CSS
.huge-axis {
  fill: red;
  font-size: xx-large;
}
CssStyleExample.java
Source code
Java
@CssImport(value = "./styles/huge-axis.css", themeFor = "vaadin-chart", include = "vaadin-chart-default-theme")
public class CssStyleExample extends Div {

    public CssStyleExample() {
        Chart chart = new Chart();
        Configuration configuration = chart.getConfiguration();

        DataSeries ds = new DataSeries();
        ds.setData(7.0, 6.9, 9.5, 14.5);
        configuration.addSeries(ds);

        configuration.getxAxis().setCategories("Jan", "Feb", "Mar", "Apr");

        // Expose the X-Axis for CSS targeting.
        configuration.getxAxis().setClassName("huge-axis");

        add(chart);
    }
}
AEB42836-8AD8-4373-BCF4-F568910B7981