CSS Styling
- Steps for styling a chart
- Example 1: Chart with Yellow Point Markers and Red Labels
- Example 2: Exposing a Chart element in Java for CSS Styling
Chart appearance is primarily controlled by CSS style rules. A comprehensive list of the supported style classes can be found here.
Steps for styling a chart
-
Create a theme file (by convention this should be
webapp/frontend/styles/shared-styles.html). The theme’s dom-module must declaretheme-for=vaadin-chart. -
Declare
include="vaadin-chart-default-theme"on the theme module’s style element to customize Chart’s default theme. -
Specify the desired CSS rules in the theme file.
-
If multiple charts are present, each one can be specifically targeted by the host selector e.g
:host(.first-chart-class). -
Import the theme file.
NoteIf there are multiple theme modules only one of them should declare the includein step 2 above.
Example 1: Chart with Yellow Point Markers and Red Labels
shared-styles.html
Source code
CSS
<link rel="import" href="../bower_components/vaadin-charts/vaadin-chart-default-theme.html">

<dom-module id="css-style-example" theme-for="vaadin-chart">
  <template>
    <style include="vaadin-chart-default-theme">
      :host(.first-chart) g.highcharts-markers > .highcharts-point {
        fill: yellow;
      }

      :host(.first-chart) .highcharts-data-label text {
        fill: red;
      }
    </style>
  </template>
</dom-module>
CssStyleExample.java
Source code
Java
@HtmlImport("frontend://styles/shared-styles.html")
public class CssStyleExample extends Div {

    public CssStyleExample() {
        Chart chart = new Chart();
        Configuration configuration = chart.getConfiguration();

        configuration.getChart().setType(ChartType.LINE);

        configuration.getxAxis().setCategories("Jan", "Feb", "Mar", "Apr");

        DataSeries ds = new DataSeries();
        ds.setData(7.0, 6.9, 9.5, 14.5);

        DataLabels callout = new DataLabels(true);
        callout.setShape(Shape.CALLOUT);
        callout.setY(-12);
        ds.get(1).setDataLabels(callout);
        ds.get(2).setDataLabels(callout);
        configuration.addSeries(ds);

        chart.addClassName("first-chart");
        add(chart);
    }
}
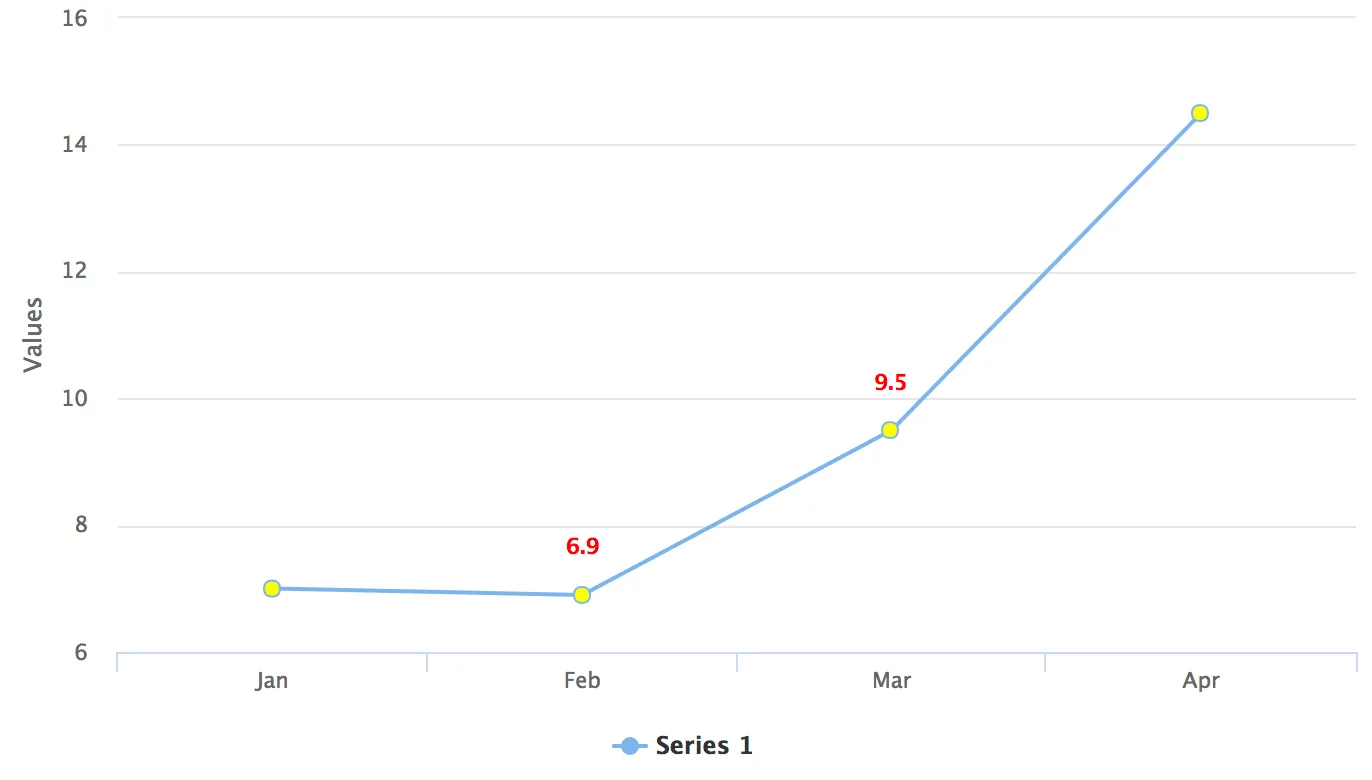
Chart with Yellow Point Markers and Red Labels
Example 2: Exposing a Chart element in Java for CSS Styling
shared-styles.html
Source code
CSS
<link rel="import" href="../bower_components/vaadin-charts/vaadin-chart-default-theme.html">

<dom-module id="css-style-example" theme-for="vaadin-chart">
  <template>
    <style include="vaadin-chart-default-theme">
      .huge-axis {
        fill: red;
        font-size: xx-large;
      }
    </style>
  </template>
</dom-module>
CssStyleExample.java
Source code
Java
@HtmlImport("frontend://styles/shared-styles.html")
public class CssStyleExample extends Div {

    public CssStyleExample() {
        Chart chart = new Chart();
        Configuration configuration = chart.getConfiguration();

        DataSeries ds = new DataSeries();
        ds.setData(7.0, 6.9, 9.5, 14.5);
        configuration.addSeries(ds);

        configuration.getxAxis().setCategories("Jan", "Feb", "Mar", "Apr");

        // Expose the X-Axis for CSS targeting.
        configuration.getxAxis().setClassName("huge-axis");

        add(chart);
    }
}
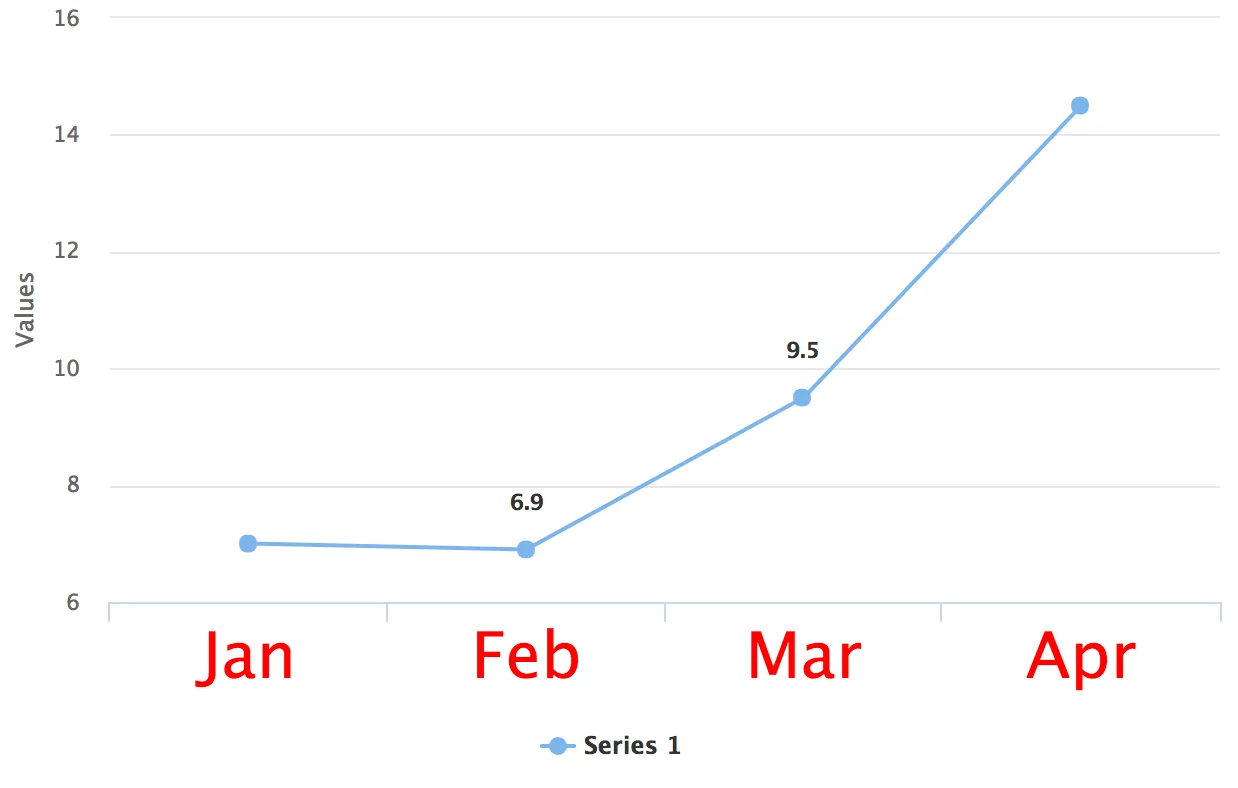
Chart with a Huge X-Axis