[ Posted on behalf of Phil B ]
Some time back, after my first introduction to Vaadin, I was on a small quest to understand how the integration with GWT actually worked. I managed to grab some of Sami’s community Friday time, he offered and I naturally accepted and we went thru the basics.
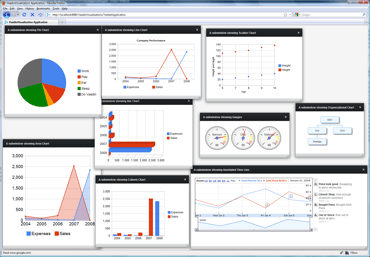
In looking to see how GWT widgets could be integrated I decided to choose something that I thought might just be useful and I’m a sucker for a graph so the snappily named Google Chart Tools / Interactive Charts (aka Visualization API) it was. Between my day job and night job and reminding myself why I am not on Facebook I created the basic integration for the charts, a breeze with just a small amount of code for each chart (there are now over 21 types of chart).
A little while after this and luckily for me, the Vaadin people decided to create an Add-ons directory, so I packaged my add-on VisualizationsForVaadin and put it in the directory. Now out of this a lot of positive things happened:
- I didn’t have anywhere of course to put up a demo Java app, so the Vaadin CEO organized a server for me deploy my apps.
- The add-on got some good feedback and seemed to be genuinely useful
- Out of the blue, Craig Conboy offered a patch to allow for colors to be set on the charts. So it seems this open source and community stuff really is working.
- After 6 months, two fifths places a fourth, third and second place I finally won an iPad.

And just in summarization, Vaadin a really nice framework for creating web apps, GWT integration and extending the widgetset is straightforward, open source and community work a real eye opener and the Add-ons directory a great initiative.
