JfreeChartWrapper not displaying chart

Hello everyone,

I am totally new with Vaadin and as well with JFreeChartWrapper I just saw a post with a JFreeChartWrapper example which I decide to try to start with:
https://dev.vaadin.com/svn/branches/sampler2/addons/com/vaadin/demo/sampler/addons/external/JFreeChartWrapperSample.java

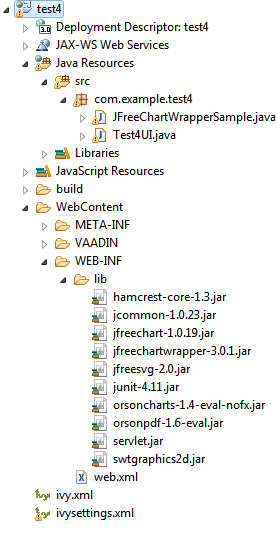
I just created a test project where I added all dependencies and I created JFreeChartWrapperSample class to add mentioned code. As that class already returns a panel I am just calling that from UI in order to show it.
It compiles well but it doesn´t show anything, so it is like it was showing an empy chart.

Maybe it is a stupid thing but I’ve been trying to figure out what could be and no success.
Could someone more familiar with that tell me what I am missing or doing wrong?

//////////Features////////////
Vaadin 7.3.2
Eclipse Luna 64bit running under Windows.
All dependencies mentioned above.
////////////////////////////////////

Adding attachments in case it can help.

I appreciate your help.
Thank you in advantage.

Gerard
16803.java (1.22 KB)
16804.java (10.1 KB)
16805.png

Hi Gerard,

I’m currently migrating a Vaadin 6.8 application to Vaadin 7.3 and have the same problem! I also made a little test project to nail the problem down, but even with this little application, I don’t see a chart!

Have you solved this problem in the mean time?

Best regards

Andreas

Just another info: I used the test code from the addon (JFreeChartWithVaadin.java) and made a tiny project with Vaadin 7.3.9, jfreechart 1.0.14 and jfreechartwrapper 3.0.2:

Still the same: program compiles and runs with out errors or warning in log but the browser doesn’t show me a chart! I can see the JavaScript Progress indicator advancing but afterwards it’s still all blank.

Does anybody use this addon together with Vaadin 7.3.9?

Looks like the addon (with jfreechartwrapper revision 3.0.2 and jfreechart 1.0.13) broke in Vaadin 7.3.9 - went back through a load of versions and 7.3.8 is the latest that seems fine. Also went forward and alas is still broken in 7.3.10 as well as 7.4.0.beta3

David,

thanks for your effort. I hope that the addon maintainer is reading this too…

I opened an issue here:
https://code.google.com/p/jfreechart-wrapper-for-vaadin/issues/detail?id=6

Hi, there indeed seems to be a regression with 7.3.X series. I’ll see if I can make a workaround for this.

We had the same problem with 7.3.10. With 7.3.8 it works fine.

Thanks Matti and have a nice weekend

Thanks, this may help, sounds like a brand new regression :frowning:

This looks like a regression in Vaadin core to me. A workaround is to call markAsDirty for the component after it is attached. Quick fix:

        JFreeChartWrapper jFreeChartWrapper = new JFreeChartWrapper(chart) {

            @Override
            public void attach() {
                super.attach();
                markAsDirty();
            }
            
        };

Hi Matti,

I tried your suggestion (Vaadin 7.3.10) but it doesn’t help wether in my application nor in the test case of the addon. With Vaadin 7.3.8 both are working as expected.

Yes, my bad, I made a mistake when searching for a workaround. Try this one:

        JFreeChartWrapper jFreeChartWrapper = new JFreeChartWrapper(jfreechart) {

                    @Override
                    public void attach() {
                        super.attach();
                        setResource("src", getSource());
                    }
                };

Great!
Now it works with Vaadin 7.3.10.

Thanks again

Perfect solution also for me. !!
Thanks

Thanks you for this !

Work like charmed… :slight_smile:
Thank you…

Thank you. :slight_smile:

I use vaadin 7.5.8 and jfreechartwrapper 3.0.2 and didn’t see the chart too. Has anybody an idea?
Or which versions must I use that it works?

package com.app.UI;

import javax.servlet.annotation.WebServlet;

import org.jfree.chart.ChartFactory;
import org.jfree.chart.JFreeChart;
import org.jfree.chart.plot.PlotOrientation;
import org.jfree.data.xy.XYSeries;
import org.jfree.data.xy.XYSeriesCollection;
import org.vaadin.addon.JFreeChartWrapper;

import com.vaadin.annotations.Theme;
import com.vaadin.annotations.Title;
import com.vaadin.annotations.VaadinServletConfiguration;
import com.vaadin.server.VaadinRequest;
import com.vaadin.server.VaadinServlet;
import com.vaadin.ui.UI;
import com.vaadin.ui.VerticalLayout;

@Theme(“mytheme”)
@Title(“TP_Mon”)

public class TP_Mon extends UI {

@Override
protected void init(VaadinRequest vaadinRequest) {

    VerticalLayout layout = new VerticalLayout(); // Gesamtlayout Haupt

    XYSeries series = new XYSeries("Sprint 1");
    series.add(0, 165);
    series.add(1, 150);
    series.add(2, 130);

    XYSeriesCollection dataset = new XYSeriesCollection();
    dataset.addSeries(series);
    // Generate the graph
    JFreeChart chart = ChartFactory.createXYLineChart("Burn Down Chart", // Title
            "days", // x-axis Label
            "Esimated Effort", // y-axis Label
            dataset, // Dataset
            PlotOrientation.VERTICAL, // Plot Orientation
            true, // Show Legend
            true, // Use tooltips
            false // Configure chart to generate URLs?
    );
    JFreeChartWrapper wrapper = new JFreeChartWrapper(chart) {
        @Override
        public void attach() {
            super.attach();
            markAsDirty();
        }
    };
    layout.addComponent(wrapper);
    setContent(layout);
}

@WebServlet(urlPatterns = "/*", name = "TP_MonServlet", asyncSupported = true)
@VaadinServletConfiguration(ui = TP_Mon.class, productionMode = false, widgetset = "com.app.gwt.AppWidgetSet")
public static class TP_MonServlet extends VaadinServlet {
}

}

News???

Thanks! Works as expected with vaadin
7.6.5
.

Hint
: Do use the second workaround!