Important Notice - Forums is archived
To simplify things and help our users to be more productive, we have archived the current forum and focus our efforts on helping developers on Stack Overflow. You can post new questions on Stack Overflow or join our Discord channel.

Vaadin lets you build secure, UX-first PWAs entirely in Java.
Free ebook & tutorial.
Vaadin Charts with x, y and timestamp values
Hello,
I am fiddling about with charts. The data I want to plot on a scattered chart have x and y values (doubles) and there is also a timestamp for every x,y combination that I would like to show in the tooltip along with the x and y values.
I read about ContainerDataSeries so I created a custom bean with x, y and date properties, put instances of that bean in a BeanItemContainer and fed the BeanItemContainer in a ContainerDataSeries and then assigned the properties to the x and y values:
for (Map.Entry<Date, Double> entry : dataX.entrySet()) {
PointWithDate point = new PointWithDate();
Date date = entry.getKey();
Double valueX = entry.getValue();
Double valueY = dataY.get(date);
if (date != null && valueX != null && valueY != null) {
point.setX(valueX);
point.setY(valueY);
point.setDate(date);
beanContainer.addBean(point);
}
}
ContainerDataSeries cDataSeries = new ContainerDataSeries(beanContainer);
cDataSeries.setXPropertyId("x");
cDataSeries.setYPropertyId("y");
return cDataSeries;
there is a cDataSeries.setNamePropertyId() but when I set this to the property date I get a "no data to display" on my chart.
I also tried accessing the "date" property with a custom Tooltip formatter
Tooltip tooltip = new Tooltip();
tooltip.setShared(true);
tooltip.setUseHTML(true);
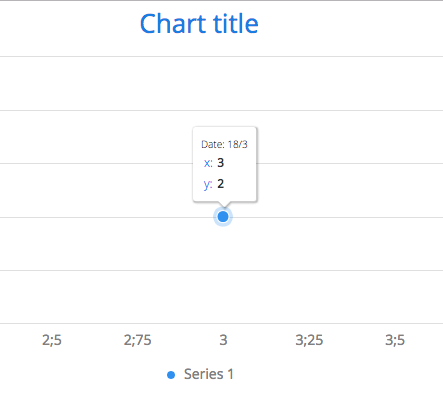
tooltip.setHeaderFormat("<small>Date: {point.date}</small><table>");
tooltip.setPointFormat("<tr><td style=\"color: {series.color}\">x: </td><td style=\"text-align: right\"><b>{point.x}</b></td></tr>"+
"<tr><td style=\"color: {series.color}\">y: </td><td style=\"text-align: right\"><b>{point.y}</b></td></tr>");
tooltip.setFooterFormat("</table>");
configuration.setTooltip(tooltip);
configuration.getTooltip().setShared(true);
with no luck : point.date is blank in the tooltip.
Can anyone enlighten me? Isn't that a pretty simple thing to do?
Regards,
George
I think the name property id should work. To me it looks right.
With the Tooltip, are you using still a container series? Try populating the DataSeries with your items.
Johannes Häyry: I think the name property id should work. To me it looks right.
With the Tooltip, are you using still a container series? Try populating the DataSeries with your items.
Hello and thanks for the reply. I am quite confused though. How can I add a custom bean to a DataSeries?
Also what do you mean when you say "the name property id should work"?
regards,
George
With "the name property id should work" I meant that I didn't see any issue in your code, so I am puzzled why doesn't it work.
You can add any bean that extends DataSeriesItem. Then you can add access your custom property in Tooltip format.
Johannes Häyry: With "the name property id should work" I meant that I didn't see any issue in your code, so I am puzzled why doesn't it work.
You can add any bean that extends DataSeriesItem. Then you can add access your custom property in Tooltip format.
Oh I see. Tried what you said and still got nothing.
my custom bean
public class PointWithDate extends DataSeriesItem{
Date date;
String formattedDate;
SimpleDateFormat sdf = new SimpleDateFormat("dd/MM/yyyy HH:mm");
public Date getDate() {
return date;
}
public void setDate(Date date) {
this.date = date;
if(date != null)
this.formattedDate = sdf.format(date);
}
public String getFormattedDate() {
return formattedDate;
}
}
then the DataSeries:
private DataSeries getDataSeries(TreeMap<Date, Double> dataX, TreeMap<Date, Double> dataY) {
DataSeries cDataSeries = new DataSeries();
for (Map.Entry<Date, Double> entry : dataX.entrySet()) {
PointWithDate point = new PointWithDate();
Date date = entry.getKey();
Double valueX = entry.getValue();
Double valueY = dataY.get(date);
if (date != null && valueX != null && valueY != null) {
point.setX(valueX);
point.setY(valueY);
point.setDate(date);
cDataSeries.add(point);
}
}
return cDataSeries;
}
and then the tooltip format:
Tooltip tooltip = new Tooltip();
tooltip.setShared(true);
tooltip.setUseHTML(true);
tooltip.setHeaderFormat("<small>Date: {point.formattedDate}</small><table>");
tooltip.setPointFormat("<tr><td style=\"color: {series.color}\">x: </td><td style=\"text-align: right\"><b>{point.x}</b></td></tr>"
+ "<tr><td style=\"color: {series.color}\">y: </td><td style=\"text-align: right\"><b>{point.y}</b></td></tr>");
tooltip.setFooterFormat("</table>");
configuration.setTooltip(tooltip);
configuration.getTooltip().setShared(true);
point.formattedDate still appears blank in the tooltip :(
Fyi when using
point.setName("some text");
or
point.setId("someId");
breaks the whole chart and it comes up empty with "no data to display" message.
Hi George,
I did a small POC using the name property and it seems to work
Chart chart = new Chart(ChartType.SCATTER);
DataSeries dataSeries = new DataSeries();
DataSeriesItem item = new DataSeriesItem(1, 1);
//you can use the name to set your custom SimpleDateFormat formatted date
item.setName("12/3");
dataSeries.add(item);
item = new DataSeriesItem(3, 2);
item.setName("18/3");
dataSeries.add(item);
item = new DataSeriesItem(5, 4);
item.setName("02/3");
dataSeries.add(item);
Configuration configuration = chart.getConfiguration();
configuration.addSeries(dataSeries);
Tooltip tooltip = new Tooltip();
tooltip.setUseHTML(true);
//Because it's the header you should use key property,
tooltip.setHeaderFormat("<small>Date: {point.key}</small><table>");
//you can use point.name in point format
tooltip.setPointFormat(
"<tr><td style=\"color: {series.color}\">x: </td><td style=\"text-align: right\"><b>{point.x}</b></td></tr>"
+ "<tr><td style=\"color: {series.color}\">y: </td><td style=\"text-align: right\"><b>{point.y}</b></td></tr>");
tooltip.setFooterFormat("</table>");
configuration.setTooltip(tooltip);
return chart;
The result is a scatter chart with the name displayed in the tooltip header as shown in the attachment.
The other option I tried and seems to work in the same way is by just using tooltip.setPointFormat and not using header nor footer:
tooltip.setHeaderFormat("");
// you can use point.name in point format
tooltip.setPointFormat(
"<small>Date: {point.name}</small><table><tr><td style=\"color: {series.color}\">x: </td><td style=\"text-align: right\"><b>{point.x}</b></td></tr>"
+ "<tr><td style=\"color: {series.color}\">y: </td><td style=\"text-align: right\"><b>{point.y}</b></td></tr></table>");
Also note I'm not setting shared to true, although that doesn't seem to affect as scatter charts do not share tooltips.
Hope this helps,
Guille
Hi Guille and thanks for the effort,
I used the exact same code and I soon as I setName() on the points I get "no data to display" in my chart.
So I figured the only thing that is different is the number of my DataSeriesItems.
I limited my items to 5 and chart came up with the correct tooltip. Started to increase it and it worked as expected up to exactly 1000 points. As soon as you put 1001 points with their name set in the DataSeries then the chart breaks and shows: "no data to display".
Try your code and create a loop to add like 1100 DataSeriesItems and let me know if that works for you.
Regards,
George
Good that you fixed the tooltip issue, the 'no data to display' seems to be a separate issue.
Fyi my sample chart renders 3000+ points with no problems as long as the name is not set.
Guillermo Alvarez: Good that you fixed the tooltip issue, the 'no data to display' seems to be a separate issue.
Well it's still not fixed. I know the way to do it however I can't use it as long as the "no data to display" kicks in because of the item name.
One step at a time :P
I guess that in the browser console you're getting the following error: "Highcharts error #12: www.highcharts.com/errors/12"
It is related to an optimization done to data serialization, if data is simple (only has X and Y values) it's serialized as an 2D array and that works for the underlying charts library. Once the name is added it becomes complex and it's serialized as an array of JSON objects.
The large complex data issue can be fixed by adding the following code:
PlotOptionsSeries options = new PlotOptionsSeries();
options.setTurboThreshold(0);
configuration.addPlotOptions(options);
Try it and let me know how it goes
Hi Guille,
thanks so much for the info. It worked! Is that documented anywhere?
George
I would expect to find that one can use a custom bean as long as it extends the DataSeriesItem class here:
https://vaadin.com/docs/-/part/charts/java-api/charts-data.html
and maybe the serialization as a 2D array / or JSON here: https://vaadin.com/docs/-/part/charts/java-api/charts-configuration.html