Hello,
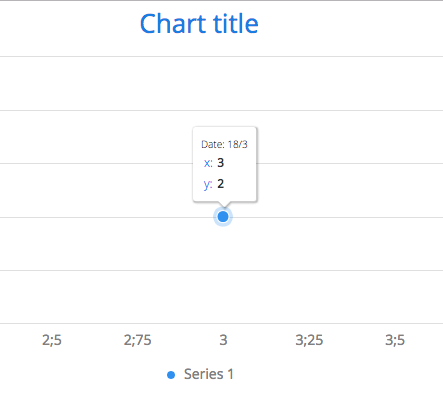
I am fiddling about with charts. The data I want to plot on a scattered chart have x and y values (doubles) and there is also a timestamp for every x,y combination that I would like to show in the tooltip along with the x and y values.
I read about ContainerDataSeries so I created a custom bean with x, y and date properties, put instances of that bean in a BeanItemContainer and fed the BeanItemContainer in a ContainerDataSeries and then assigned the properties to the x and y values:
        for (Map.Entry<Date, Double> entry : dataX.entrySet()) {

            PointWithDate point = new PointWithDate();
            Date date = entry.getKey();
            Double valueX = entry.getValue();
            Double valueY = dataY.get(date);

            if (date != null && valueX != null && valueY != null) {
                point.setX(valueX);
                point.setY(valueY);
                point.setDate(date);
                beanContainer.addBean(point);
            }

        }

ContainerDataSeries cDataSeries = new ContainerDataSeries(beanContainer);
        cDataSeries.setXPropertyId("x");
        cDataSeries.setYPropertyId("y");
        return cDataSeries;
there is a cDataSeries.setNamePropertyId() but when I set this to the property date I get a “no data to display” on my chart.
I also tried accessing the “date” property with a custom Tooltip formatter
        Tooltip tooltip = new Tooltip();
        tooltip.setShared(true);
        tooltip.setUseHTML(true);
        tooltip.setHeaderFormat("<small>Date: {point.date}</small><table>");
        tooltip.setPointFormat("<tr><td style=\"color: {series.color}\">x: </td><td style=\"text-align: right\"><b>{point.x}</b></td></tr>"+
                                "<tr><td style=\"color: {series.color}\">y: </td><td style=\"text-align: right\"><b>{point.y}</b></td></tr>");
        tooltip.setFooterFormat("</table>");
        configuration.setTooltip(tooltip);
        configuration.getTooltip().setShared(true);
with no luck : point.date is blank in the tooltip.
Can anyone enlighten me? Isn’t that a pretty simple thing to do?
Regards,
George
