Scatter3d zAxis ?

Hi there,
i try to implement a scatter chart with vaadin charts. So far all works fine except the z-axis labels and the tooltip are not correct.

This is the tooltip code:

    Tooltip tooltip = new Tooltip();
     tooltip.setFormatter("function() { return '" + organismSelect.getValue().toString() + ", "
     + antibioticOneSelect.getValue().toString() + ": '+ this.x +' mm, " + " '+'"
     + antibioticTwoSelect.getValue().toString() + ": '+ this.y +' mm, " + " '+'"
     + antibioticThreeSelect.getValue().toString() + ": '+ this.z +' mm, '+this.point.name;}");

The tooltip appears but z is NaN …

Another question is why is the z axis without any label for the ticks?

zAxis.setMin(0);
zAxis.setMax(34);

yAxis.setCategories(new String { “<=6”, “7”, “8”, “9”, “10”, “11”, “12”, “13”, “14”, “15”, “16”, “17”, “18”,
“19”, “20”, “21”, “22”, “23”, “24”, “25”, “26”, “27”, “28”, “29”, “30”, “31”, “32”, “33”, “34”, “35”,
“36”, “37”, “38”, “39”, “>=40” });

Kind regads,
Matthias
26906.png

Hi Matthias,

Have you tried using this.point.z in the tooltip?

Hi Guillermo,
thank you, that worked for me …

But whats with the zAxis scalling:

ZAxis zAxis = new ZAxis();
zAxis.setMin(0);
zAxis.setMax(34);
zAxis.setTitle(“Hemmhof (mm)”);
zAxis.setCategories(new String { “<=6”, “7”, “8”, “9”, “10”, “11”, “12”, “13”, “14”, “15”, “16”, “17”, “18”,
“19”, “20”, “21”, “22”, “23”, “24”, “25”, “26”, “27”, “28”, “29”, “30”, “31”, “32”, “33”, “34”, “35”,
“36”, “37”, “38”, “39”, “>=40” });

Its never visible as you can see in the scatter3d.png …

Any ideas ?

Hi,

Categories should work for zaxis, I would try with a simpler example and add more complexity until figuring out what’s causing them not to show.

What kind of z values does your data have? Number between 0-35? By default some category labels may be hidden if they don’t fit, but some of them should be there at least.

If you can attach one code snippet of a chart configuration as simple as possible with data that doesn’t show the labels I can try to take a look

Best regards,

Hi Guillermo,
thank you for your help! This is a small example of what I’m trying to do (with the Option3d I played around):

private Component calculatedChart() {
Chart chart = new Chart(ChartType.SCATTER);

    chart.setImmediate(true);
    chart.setHeight("100%"); 

    ///Simple
    SimpleDateFormat simpleDateFormat = new SimpleDateFormat("dd.MM.yyyy");
    Configuration configuration = chart.getConfiguration();
    PlotOptionsColumn plotOptions = new PlotOptionsColumn();
    DataLabels labels = new DataLabels(true);
    plotOptions.setDataLabels(labels);
    configuration.setPlotOptions(plotOptions);

    XAxis xAxis = new XAxis();
    //xAxis.setTickInterval(1);
    xAxis.setMin(0);
    xAxis.setMax(34);
    xAxis.setLineWidth(10);
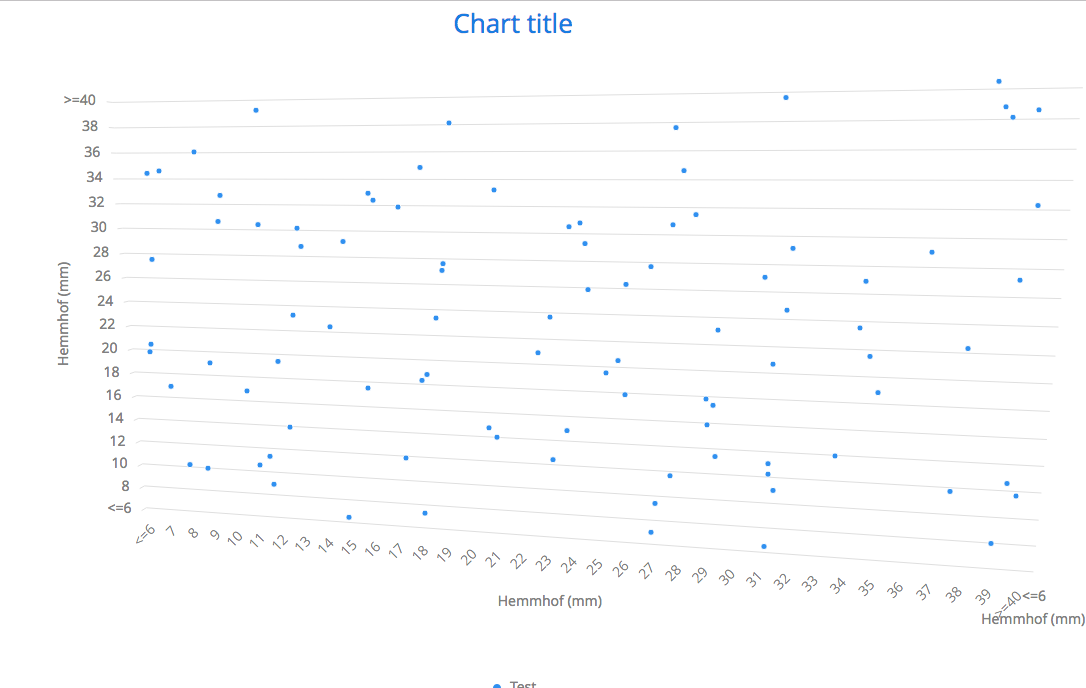
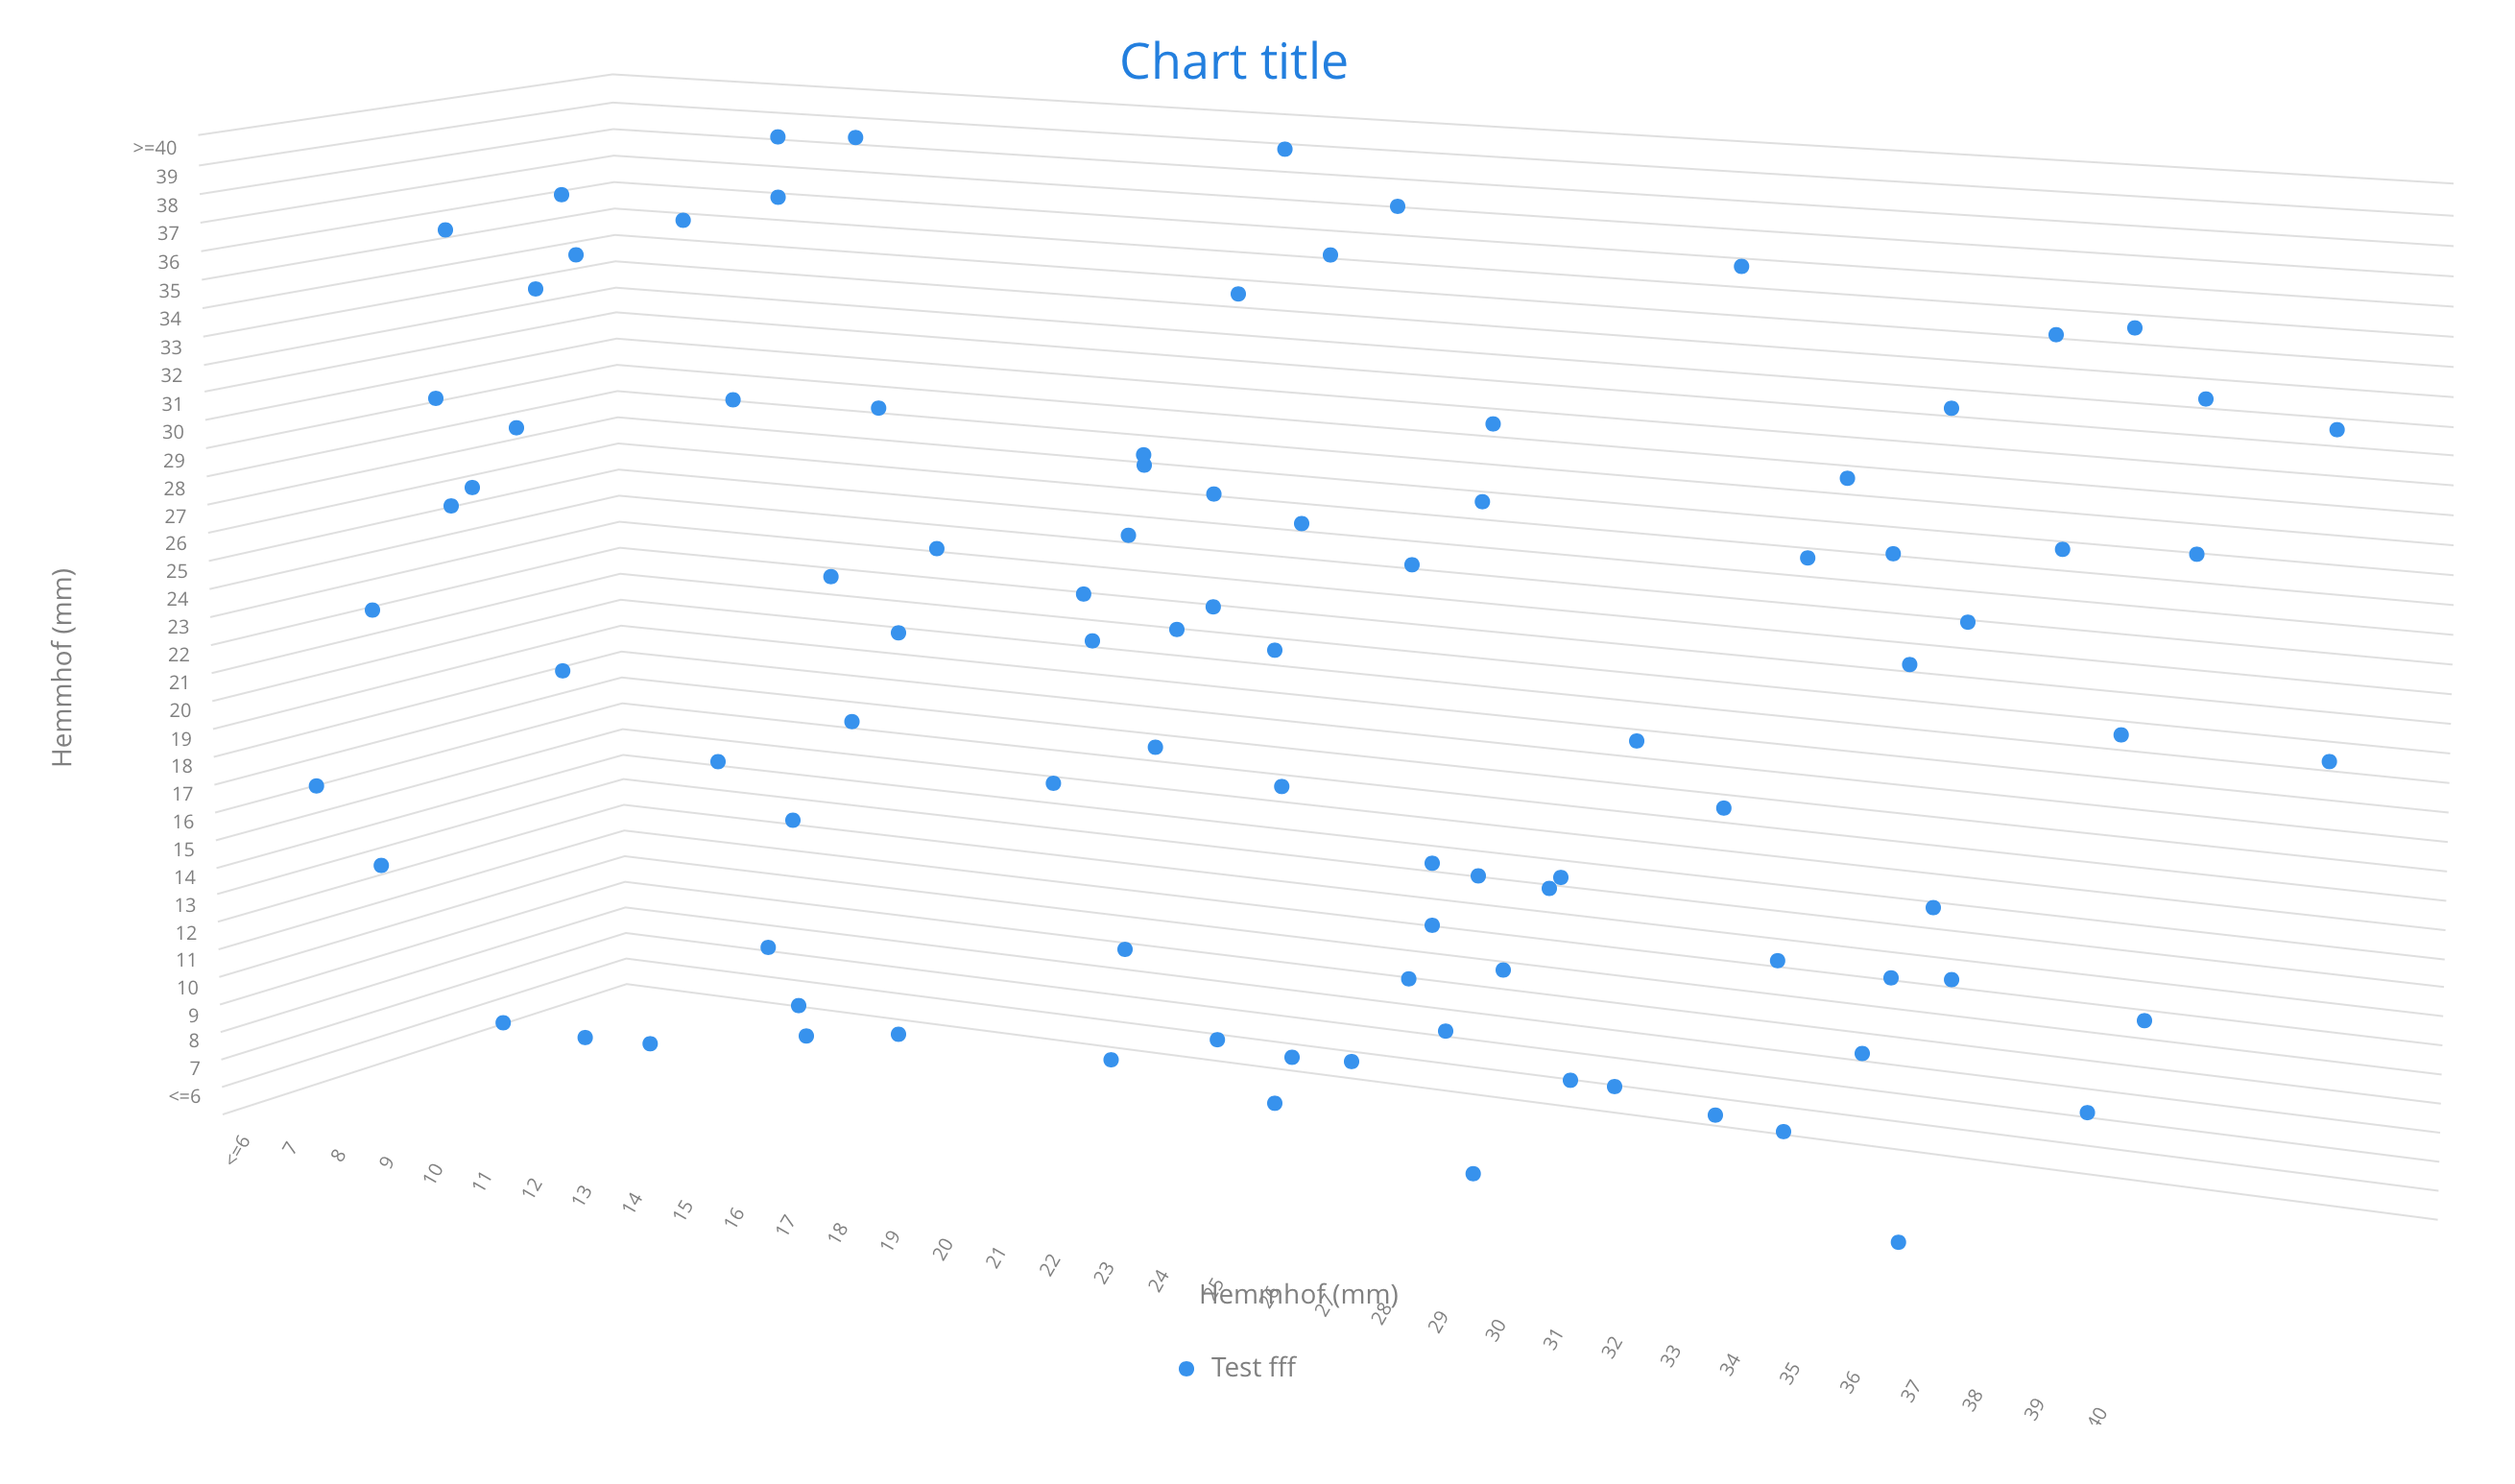
    xAxis.setTitle("Hemmhof (mm)");
    xAxis.setCategories(new String[] { "<=6", "7", "8", "9", "10", "11", "12", "13", "14", "15", "16", "17", "18",
            "19", "20", "21", "22", "23", "24", "25", "26", "27", "28", "29", "30", "31", "32", "33", "34", "35",
            "36", "37", "38", "39", ">=40" });

    configuration.addxAxis(xAxis);

    YAxis yAxis = new YAxis();
    //yAxis.setTickInterval(1);
    yAxis.setMin(0);
    yAxis.setMax(34);
    yAxis.setLineWidth(10);
    yAxis.setTitle("Hemmhof (mm)");

    yAxis.setCategories(new String[] { "<=6", "7", "8", "9", "10", "11", "12", "13", "14", "15", "16", "17", "18",
            "19", "20", "21", "22", "23", "24", "25", "26", "27", "28", "29", "30", "31", "32", "33", "34", "35",
            "36", "37", "38", "39", ">=40" });

    configuration.addyAxis(yAxis);

    ZAxis zAxis = new ZAxis();
    //zAxis.setTickInterval(1);
    zAxis.setMin(0);
    zAxis.setMax(34);
    zAxis.setTitle("Hemmhof (mm)");
    zAxis.setCategories(new String[] { "<=6", "7", "8", "9", "10", "11", "12", "13", "14", "15", "16", "17", "18",
            "19", "20", "21", "22", "23", "24", "25", "26", "27", "28", "29", "30", "31", "32", "33", "34", "35",
            "36", "37", "38", "39", ">=40" });

    configuration.addzAxis(zAxis);

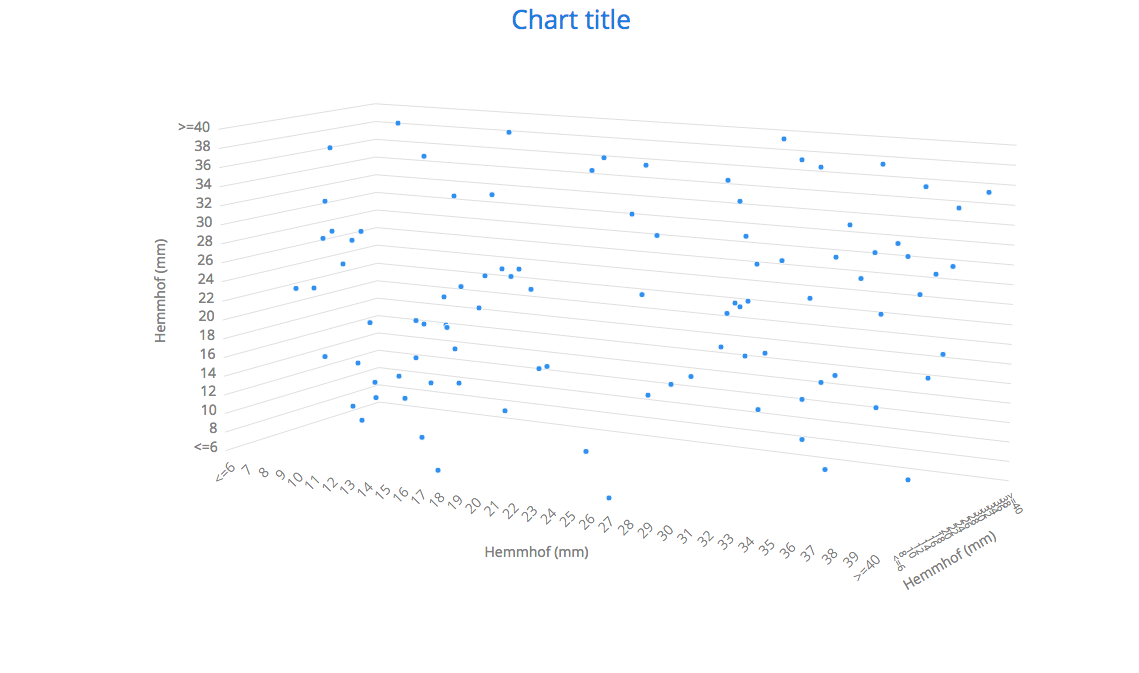
    Options3d options3d = new Options3d();
    options3d.setEnabled(true);
    options3d.setDepth(10);
    options3d.setAlpha(10);
    options3d.setBeta(10);        
    options3d.setViewDistance(100);

    chart.getConfiguration().getChart().setOptions3d(options3d);
    
    List<Object[]> values = new ArrayList();
    for (int i=0;i<100;i++) {
        Object[] value = new Object[3]

;
Random r = new Random();
double randomValue = 35 * r.nextDouble();
value[0]
= randomValue;

        randomValue = 35 * r.nextDouble();
        value[1]

= randomValue;

        randomValue = 35 * r.nextDouble();
        value[2]

= randomValue;
values.add(value);
}

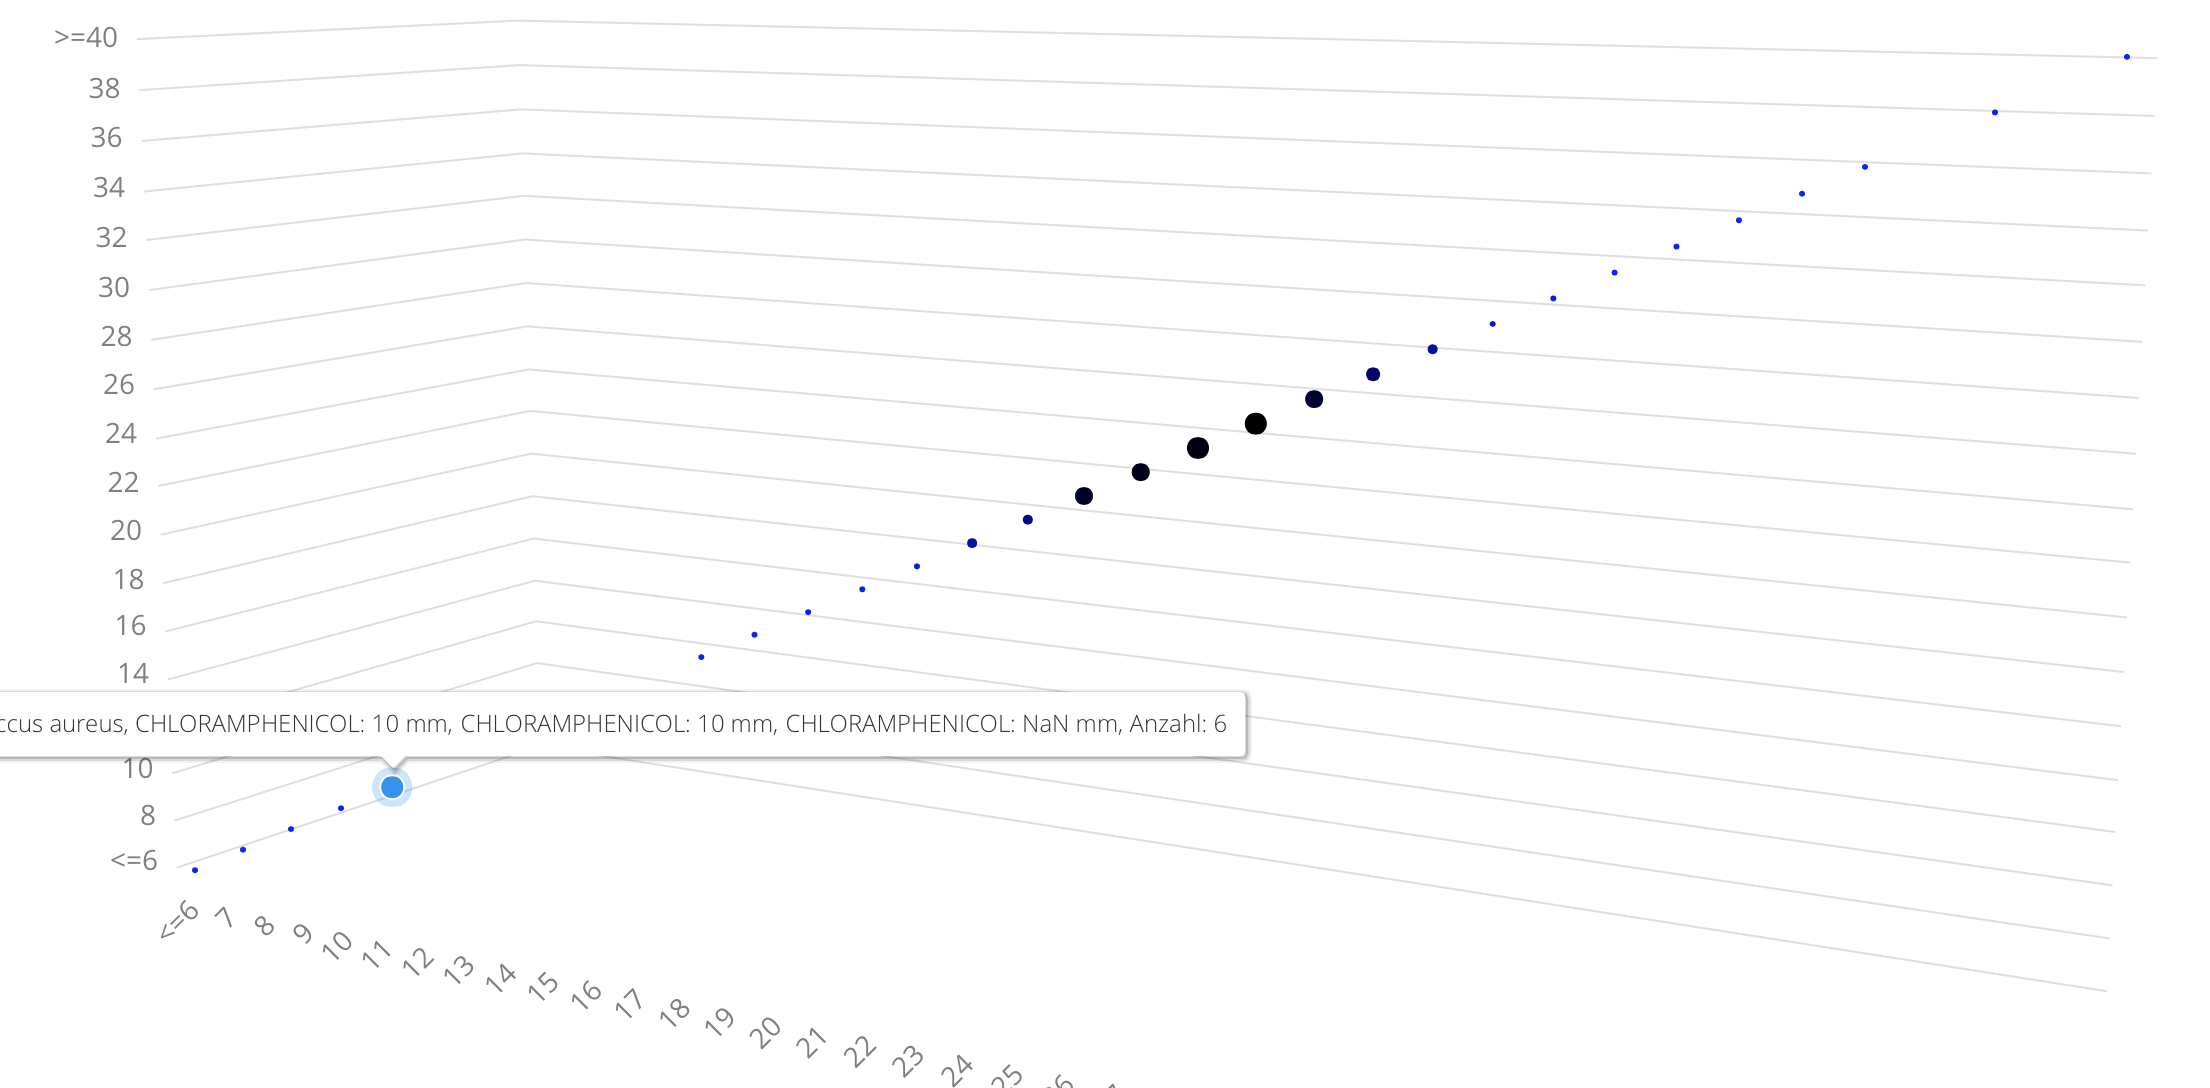
    DataSeries dataSeries = new DataSeries("Test");
    int count = 0;    

    for (Object[] value : values) {      
            DataSeriesItem3d point = new DataSeriesItem3d((Double) value[0]

,
(Double) value[1]
,
(Double) value[2]
);
count++;
point.setName("Anzahl: " + count);
Marker marker = new Marker();
marker.setLineWidth(1); // Normally zero width
marker.setRadius(3);
point.setMarker(marker);
dataSeries.add(point);
}

    configuration.addSeries(dataSeries);
    chart.drawChart(configuration);
    
    ///End Simple
    return chart;
}

Did some changes to your example to make it look a bit better. I’m using Vaadin Charts 3.1.0 (3.0.0 should work the same).

First I changed Options3d configuration to make the zAxis more visible:

options3d.setDepth(400); options3d.setAlpha(10); options3d.setBeta(30); options3d.setViewDistance(10); This are just some magic numbers I tried, you can try changing them again it might show even better.

After this change the axis is shown and some labels are shown too, not all of them since overlapping labels are not shown by default.

You can force showing all labels but they will be overlapping by doing:

zAxis.getLabels().setStep(1); Other options to considerate are:

zAxis.getLabels().setRotation(60);

Or zAxis.getLabels().getStyle().setFontSize("10px"); It’s possible that some combinations do not work, please report them if found.

Something else I tried was changing the title rotation:

zAxis.getTitle().setRotation(-30); //the opposite of the chosen beta Doing all the changes I mentioned except for setting the labels step the result is as shown in the final attachment

Hope this helps
27302.png
27303.png

Hi Guillermo,
I played arround for hours now, but the z axis never appears ;-( … plz see the attached image … Im using 3.0.0 or 3.1.0 … no effect … any ideas what i can do now ?

Another question: can i rotate the Chart? Like here http://www.highcharts.com/demo/3d-scatter-draggable

Thank you so mutch!
Matthias
27408.png

That’s weird, do you get any client-side exception? check the browser console.
The only thing I can think is that with the version changes there’s a mix of versions, if that was the case compiling widgetset could help.
Do you have another version of highcharts loaded from some other add-on or manually loaded? That could be an issue too.
If compiling widgetset doesn’t work I would recommend testing with a clean project, created for instance with the maven archetype and just adding vaadin charts dependency

mvn archetype:generate -DarchetypeGroupId=com.vaadin \ -DarchetypeArtifactId=vaadin-archetype-application \ -DarchetypeVersion=LATEST Not sure what else could help to diagnose the issue.
Regarding the chart rotation if you check how it’s implemented in the
demo
it’s binding events to the chart and the documents and that’s not so trivial to do with java API, I’d say it’s not supported out of the box with Vaadin Charts but there might be a hacky solution for it but it would need some research.

Yep, that was the problem …

What was it?

Do you get the correct zAxis now?