Hi Guillermo,
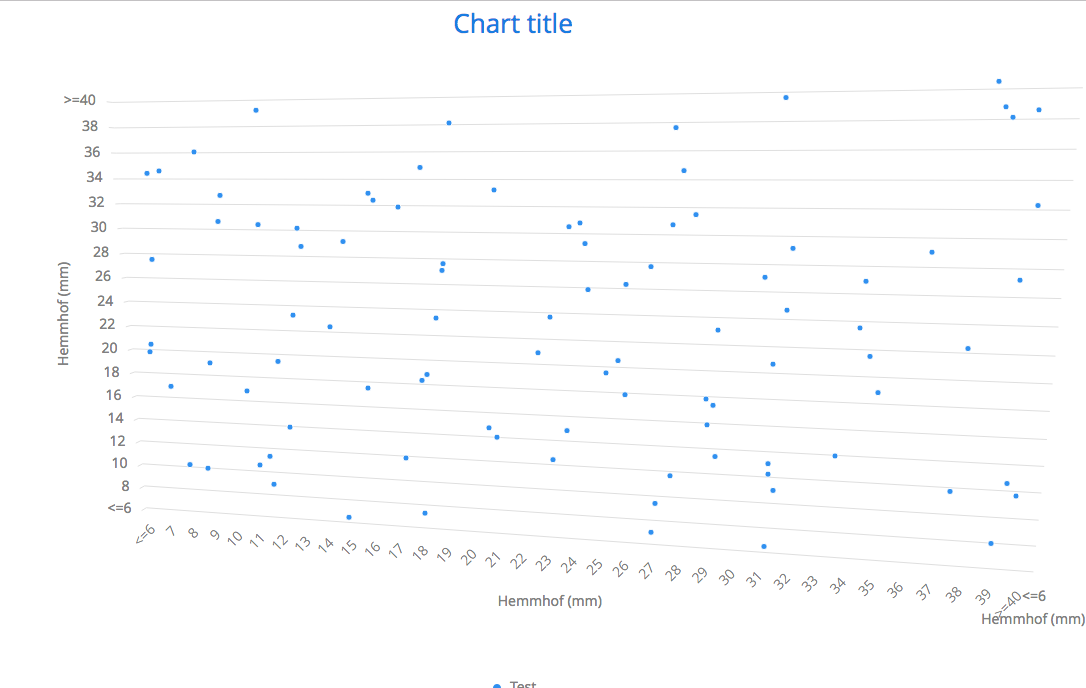
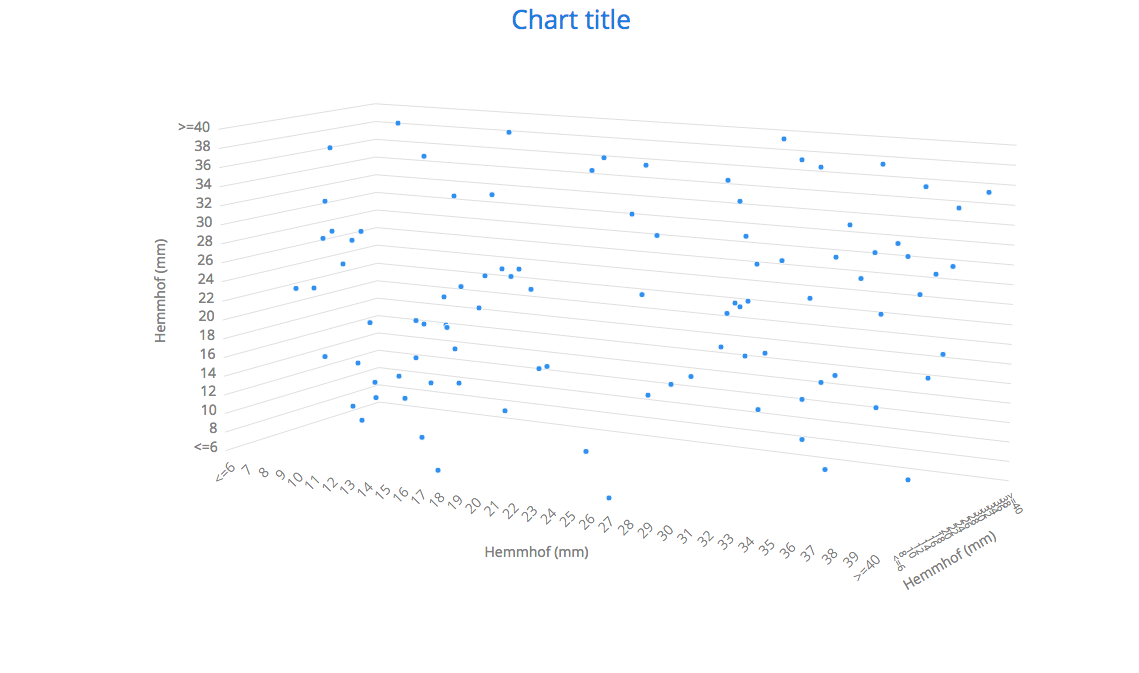
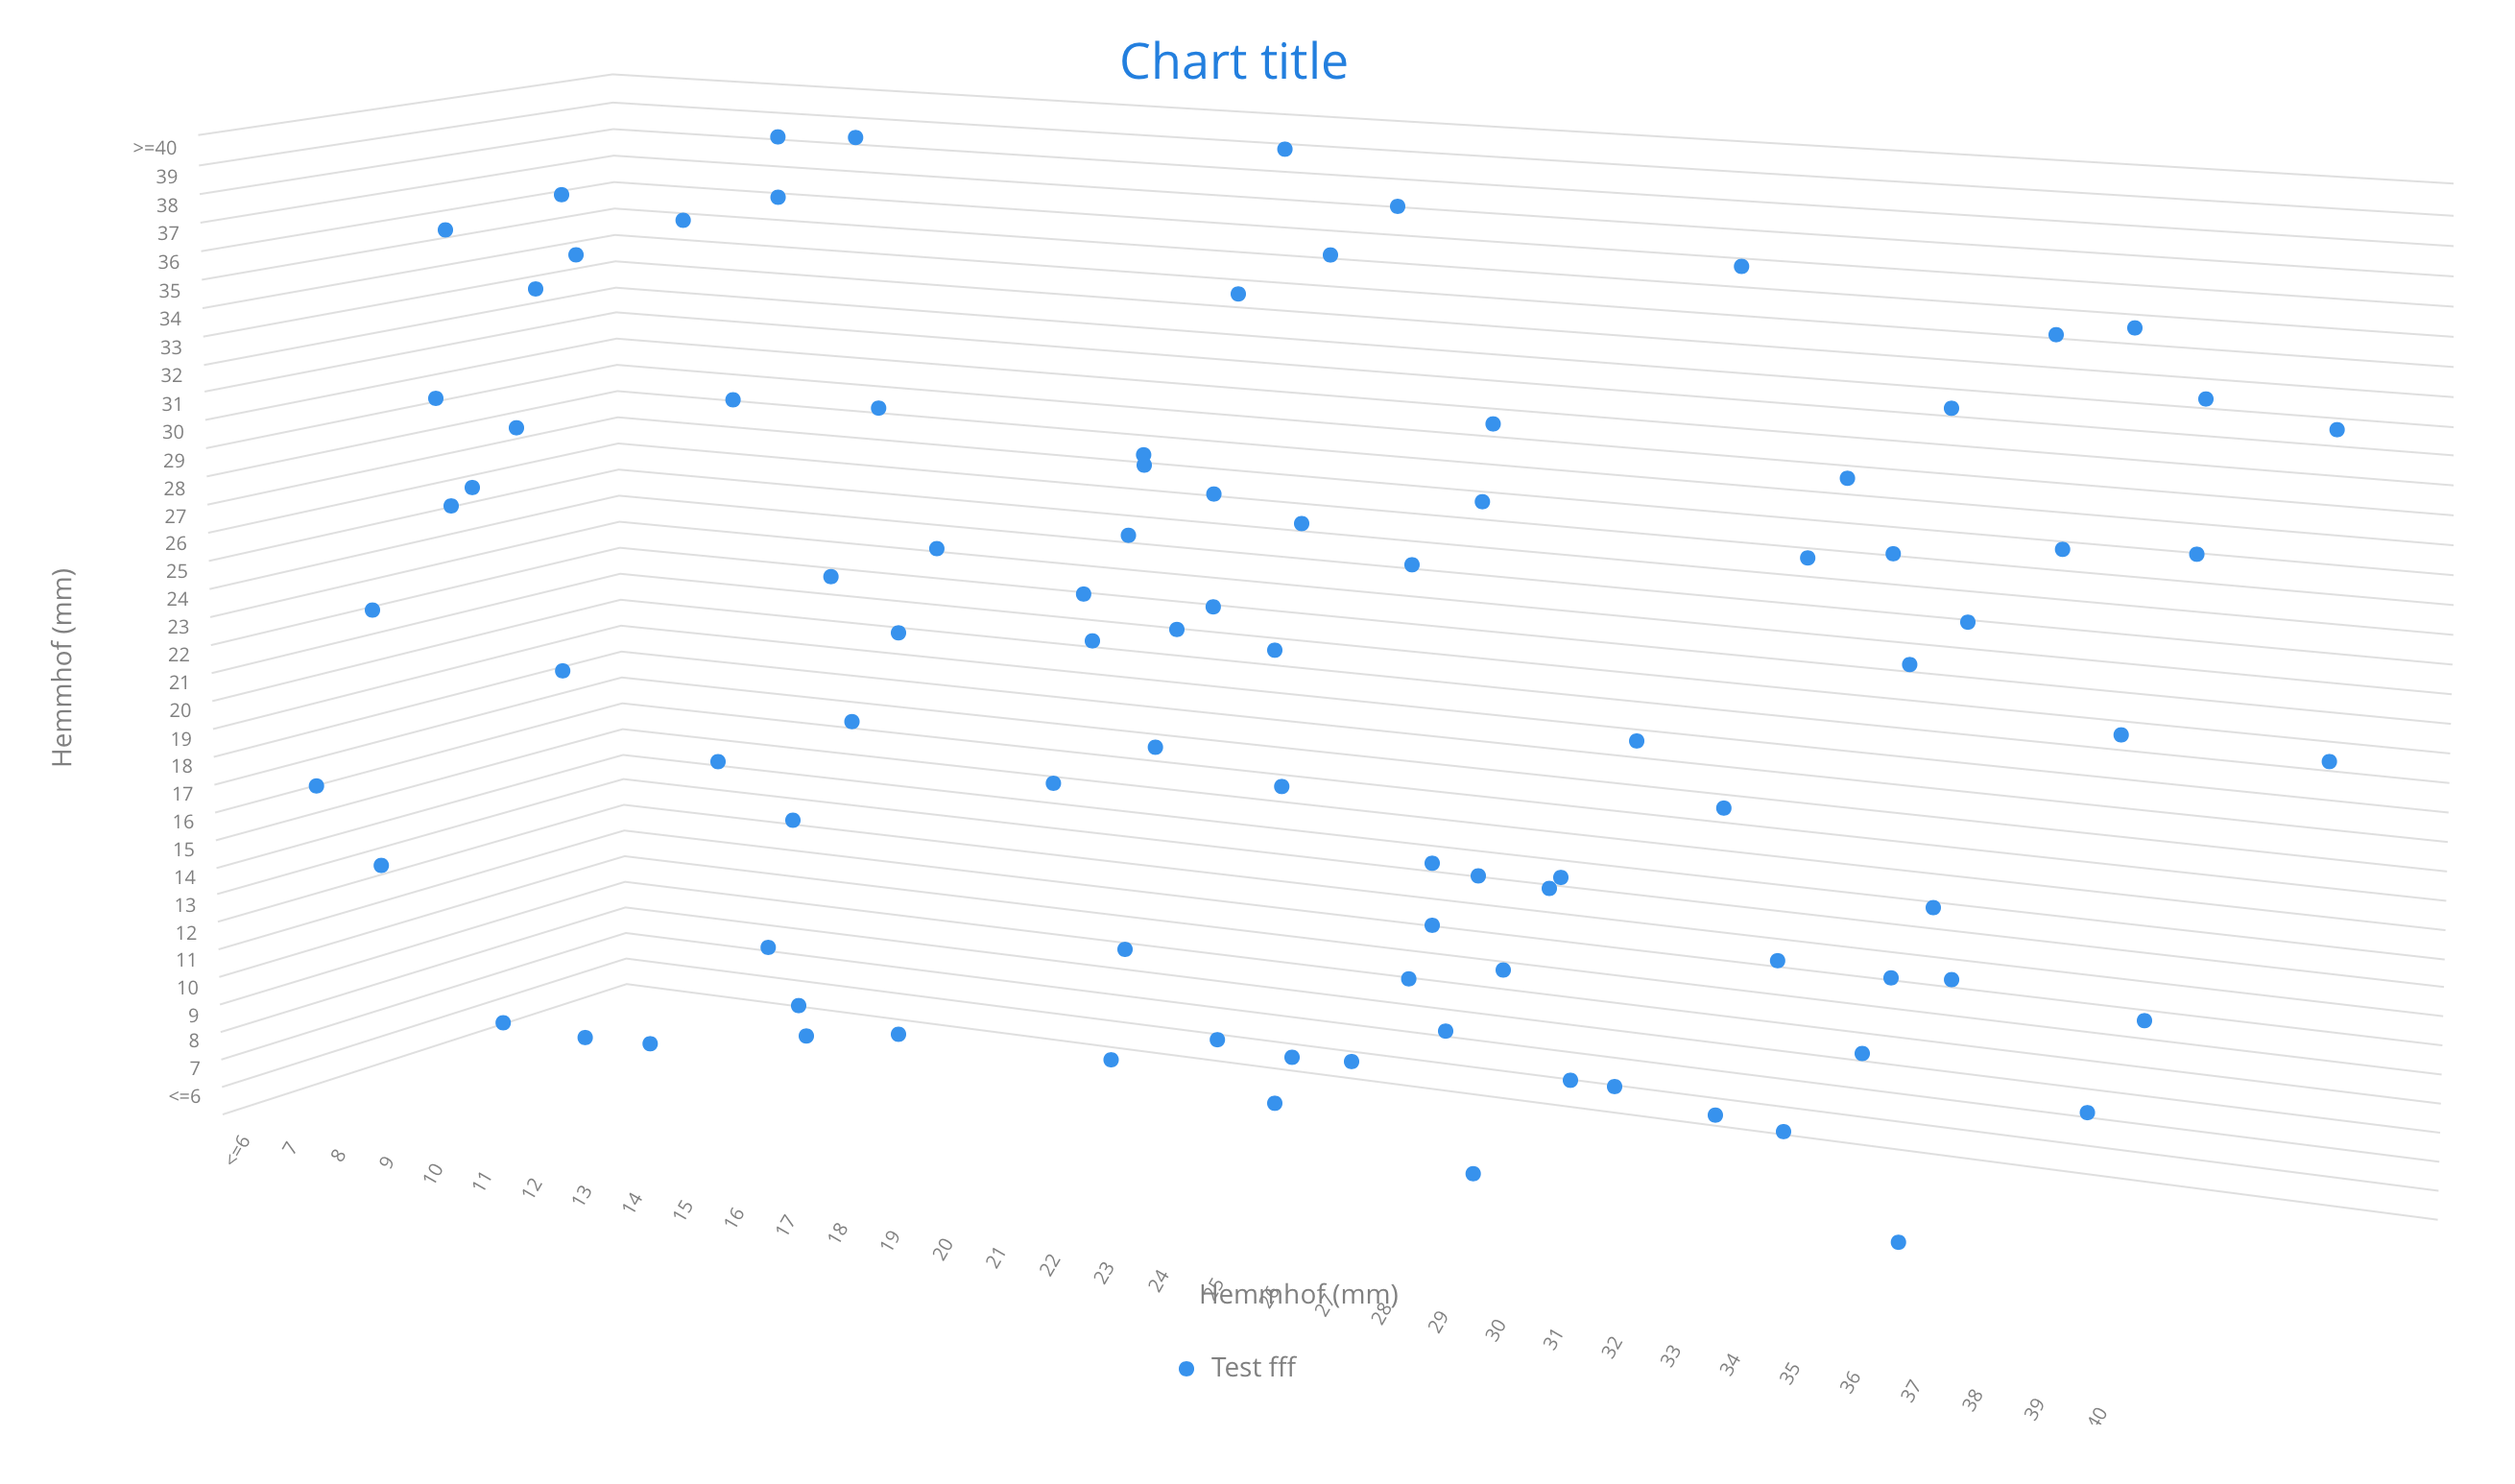
thank you for your help! This is a small example of what I’m trying to do (with the Option3d I played around):
private Component calculatedChart() {
Chart chart = new Chart(ChartType.SCATTER);
    chart.setImmediate(true);
    chart.setHeight("100%");

    ///Simple
    SimpleDateFormat simpleDateFormat = new SimpleDateFormat("dd.MM.yyyy");
    Configuration configuration = chart.getConfiguration();
    PlotOptionsColumn plotOptions = new PlotOptionsColumn();
    DataLabels labels = new DataLabels(true);
    plotOptions.setDataLabels(labels);
    configuration.setPlotOptions(plotOptions);

    XAxis xAxis = new XAxis();
    //xAxis.setTickInterval(1);
    xAxis.setMin(0);
    xAxis.setMax(34);
    xAxis.setLineWidth(10);
    xAxis.setTitle("Hemmhof (mm)");
    xAxis.setCategories(new String[] { "<=6", "7", "8", "9", "10", "11", "12", "13", "14", "15", "16", "17", "18",
            "19", "20", "21", "22", "23", "24", "25", "26", "27", "28", "29", "30", "31", "32", "33", "34", "35",
            "36", "37", "38", "39", ">=40" });

    configuration.addxAxis(xAxis);

    YAxis yAxis = new YAxis();
    //yAxis.setTickInterval(1);
    yAxis.setMin(0);
    yAxis.setMax(34);
    yAxis.setLineWidth(10);
    yAxis.setTitle("Hemmhof (mm)");

    yAxis.setCategories(new String[] { "<=6", "7", "8", "9", "10", "11", "12", "13", "14", "15", "16", "17", "18",
            "19", "20", "21", "22", "23", "24", "25", "26", "27", "28", "29", "30", "31", "32", "33", "34", "35",
            "36", "37", "38", "39", ">=40" });

    configuration.addyAxis(yAxis);

    ZAxis zAxis = new ZAxis();
    //zAxis.setTickInterval(1);
    zAxis.setMin(0);
    zAxis.setMax(34);
    zAxis.setTitle("Hemmhof (mm)");
    zAxis.setCategories(new String[] { "<=6", "7", "8", "9", "10", "11", "12", "13", "14", "15", "16", "17", "18",
            "19", "20", "21", "22", "23", "24", "25", "26", "27", "28", "29", "30", "31", "32", "33", "34", "35",
            "36", "37", "38", "39", ">=40" });

    configuration.addzAxis(zAxis);

    Options3d options3d = new Options3d();
    options3d.setEnabled(true);
    options3d.setDepth(10);
    options3d.setAlpha(10);
    options3d.setBeta(10);
    options3d.setViewDistance(100);

    chart.getConfiguration().getChart().setOptions3d(options3d);

    List<Object[]> values = new ArrayList();
    for (int i=0;i<100;i++) {
        Object[] value = new Object[3]
;
Random r = new Random();
double randomValue = 35 * r.nextDouble();
value[0]
= randomValue;
        randomValue = 35 * r.nextDouble();
        value[1]
= randomValue;
        randomValue = 35 * r.nextDouble();
        value[2]
= randomValue;
values.add(value);
}
    DataSeries dataSeries = new DataSeries("Test");
    int count = 0;

    for (Object[] value : values) {
            DataSeriesItem3d point = new DataSeriesItem3d((Double) value[0]
,
(Double) value[1]
,
(Double) value[2]
);
count++;
point.setName("Anzahl: " + count);
Marker marker = new Marker();
marker.setLineWidth(1); // Normally zero width
marker.setRadius(3);
point.setMarker(marker);
dataSeries.add(point);
}
    configuration.addSeries(dataSeries);
    chart.drawChart(configuration);

    ///End Simple
    return chart;
}


