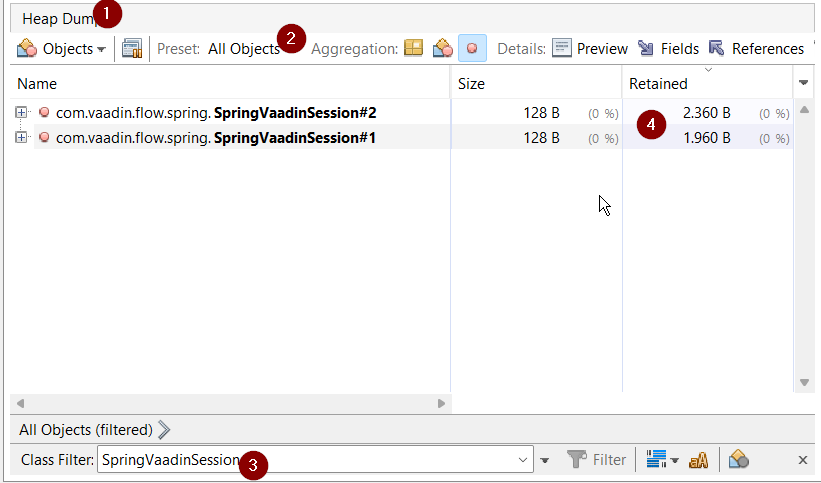
I investigated a little bit in order to understand the foodprint. Am i right, that i have correctly found the values in VisualVM, which are most important to track sessions sizes?
I am logged in currently locally in Chrome and in Edge, so there are to sessions which are around 2kb each.
Is this the value i should have an eye on in order to prevent “memory flooding”?
Is there a way to get the approximate size programatically? Tried gettings some code with AI but it shows me that each session is 9MB but it calculates it a little bit ununderstandable
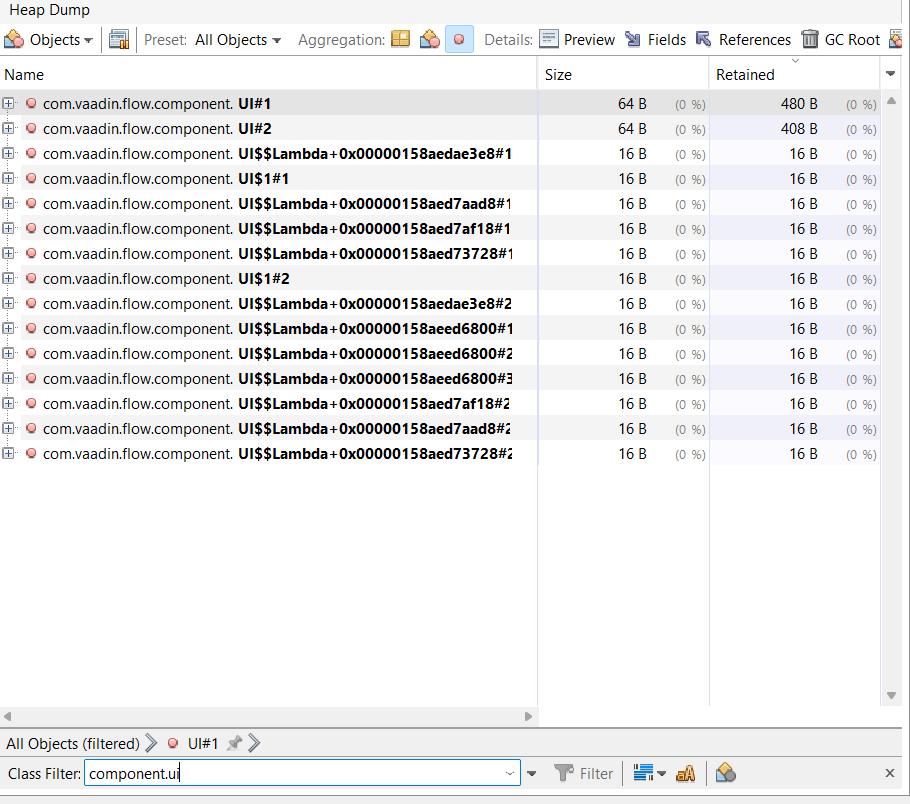
Those retained sizes from a heap dump are not always reliable. As an example, multi-user collaboration typically means that each UI has a reference to some kind of event bus which in turn has references to all other UIs.
Instead, I recommend measuring the actual consumption by comparing the heap size before and after opening a view. There’s some noise in this measurement due to background activity and e.g. asynchronous garbage collection so you need to test it with e.g. 100 UIs to make things average out.
Thank you, but it feels kind of “haveing luck to find the matching log” i would like to have a view where i can see how many sessions, users etc. are logged in, thats why i wanted to check if its possible to read the session size during runtime.
Anyhow there must be a way to track the foodprint, how does other guys handle that? I have Azure Dashboard with memory pressure, average usage etc, but its also kind of “have luck” its not on point to excactly see whats happeing in the memory
My suggestion assumes that you do this kind of testing in isolation rather than as part of a regular production deployment with constant activity. Otherwise, you will always have all kinds of random fluctuations that make it difficult to create a correlation between different changes.
If you want to measure in production, then one thing you could do is to use a similar approach with the UI init and detach listeners to keep track of the number of active users. You can use Open Telemetry to send those events to e.g. Azure Monitor together with regular Java metrics like heap size and so on.
I have changed the output to MB and added some icons to filter in the logs. What does that say? 1 Session with 100 Tabs not the same like 100 different users or?
1 Browser 100 UIs New record for 40 UIs: 77.83 MB New record for 40 UIs: 77.82 MB New record for 40 UIs: 77.75 MB New record for 40 UIs: 77.72 MB New record for 40 UIs: 77.71 MB New record for 40 UIs: 77.70 MB New record for 40 UIs: 77.70 MB New record for 40 UIs: 77.70 MB New record for 58 UIs: 129.93 MB New record for 58 UIs: 94.51 MB New record for 58 UIs: 80.45 MB New record for 58 UIs: 80.44 MB New record for 58 UIs: 80.43 MB New record for 58 UIs: 80.43 MB New record for 64 UIs: 80.61 MB New record for 64 UIs: 80.59 MB New record for 76 UIs: 105.33 MB New record for 76 UIs: 81.18 MB New record for 76 UIs: 81.17 MB New record for 79 UIs: 85.70 MB New record for 79 UIs: 85.15 MB New record for 79 UIs: 85.14 MB New record for 89 UIs: 85.31 MB New record for 89 UIs: 85.29 MB New record for 89 UIs: 85.09 MB New record for 89 UIs: 85.06 MB New record for 89 UIs: 85.04 MB New record for 89 UIs: 85.04 MB New record for 101 UIs: 98.16 MB New record for 101 UIs: 96.63 MB New record for 110 UIs: 93.69 MB New record for 110 UIs: 93.68 MB
New record for no UIs: 72.95 MB Diff: 20.74 MB Diff per UI: 0.19 MB
And the following output is from 2 users (2 browsers so 2 sessions) with each 10 tabs New record for 21 UIs: 80.47 MB New record for 21 UIs: 73.89 MB New record for 21 UIs: 73.89 MB New record for 21 UIs: 73.89 MB New record for 21 UIs: 73.38 MB
New record for no UIs: 71.57 MB Diff: 1.82 MB Diff per UI: 0.09 MB
And this test shows 4 browsers 1 UI New record for 4 UIs: 82.96 MB New record for 4 UIs: 73.89 MB New record for 4 UIs: 73.12 MB
New record for no UIs: 72.45 MB Diff: 0.67 MB Diff per UI: 0.17 MB New record for no UIs: 72.34 MB Diff: 0.78 MB Diff per UI: 0.20 MB
PS i have seen that i keep Hibernate Entities in lists. This will produce some overhead and should be changed to a DTO, right?
I will try this tomorrow on a more powerful maschine, does anyone have some suggestions how to improve the script/output? Currently its necassary to reboot the system after a test, because it keeps the statistics in mem. Maybe someone made something similar
1 Session with 100 Tabs not the same like 100 different users or?
There’s typically a little bit of extra overhead per session but that’s in the 100 - 1000 byte range and thus quite insignificant compared to the memory used by UIs.
It seems like two out of the three tests you conducted ended up around 200 kB per UI which fits nicely in the expected 100 - 1000 kB range. There’s always some random effects that might affect any given test which is why it’s useful to do several runs with many UIs each and also ignore any outliers. As you saw in the last example, it first reported that 170 kB per UI had been released and then slightly later even more memory was released and the calculation adjusted to 200 kB. There’s a possibility that something similar would also have happened in the 21 UI case if you would have waited longer.
i have seen that i keep Hibernate Entities in lists. This will produce some overhead and should be changed to a DTO, right?
The difference between an entity and a DTO is in itself relatively small. The entity has a little bit of extra metadata associated but the data itself is the same. You can avoid most of that metadata by using detached entities instead of the regular ones. Another potential benefit of using DTOs is that it makes it easier to control which relationships are actually loaded, but that can also be handled with entities with careful handling of lazy relationships and/or entity graphs.
Currently its necassary to reboot the system after a test, because it keeps the statistics in mem. Maybe someone made something similar
I guess some additional logic could be added to the script to make it reset itself when the number of UIs increase from 0. This could also be useful to detect whether there’s any memory leak since you should get back to roughly the same number each time you go down to 0 UIs even if there’s been many hundreds of UIs in total.
With kubernetes-kit you can extend TransientInjectableObjectStreamFactory and wrap the outputstream it creates with a CountingOutputStream, which you can then hook up to micrometer and expose session sizes
Locally, configure servlet container to serialize sessions to disk and inspect the file sizes.
It depends a bit of your DTO vs entity. If you want to show a combobox that could be a DTO of an id and label but you’re using the entity that has 50 attributes of varchar(1000) then you might see the difference. If your entity contains an id and text column, that won’t make the difference.