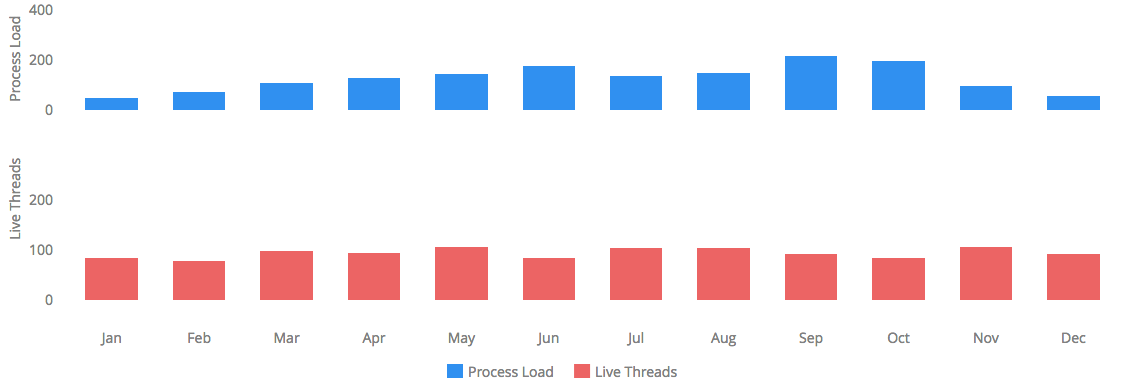
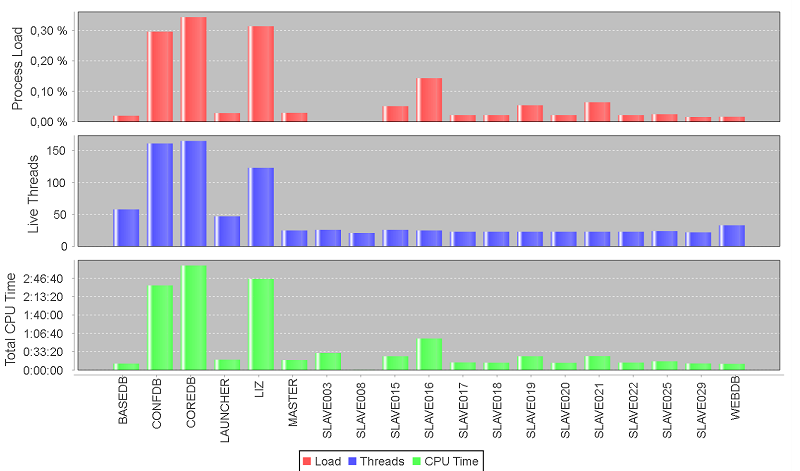
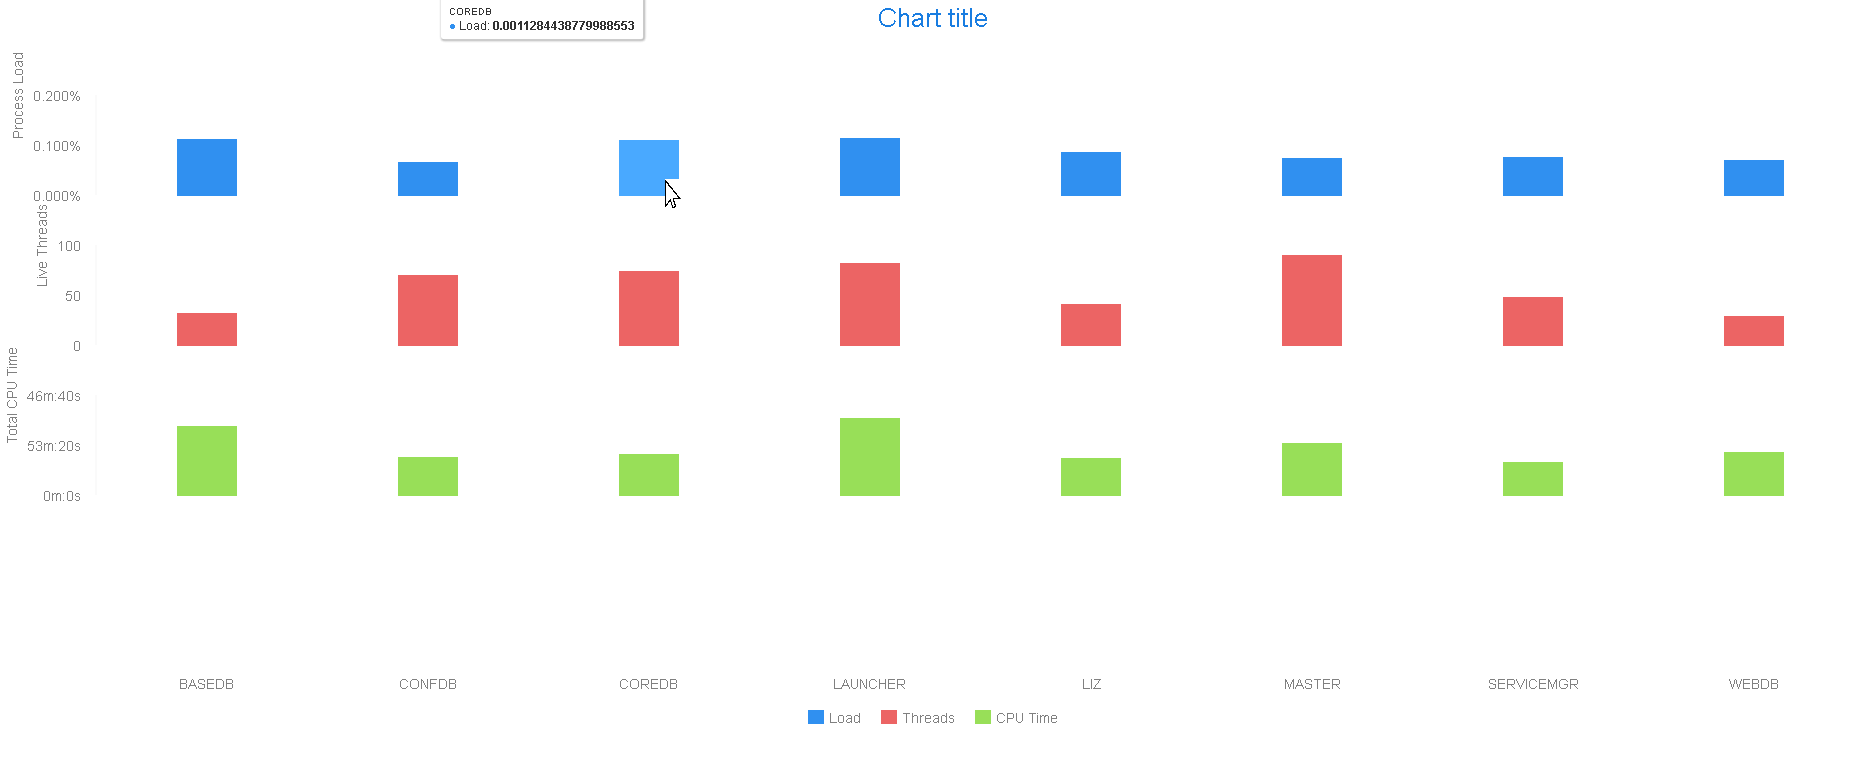
Did a quick test and looks like you need to set offset 0 to the different Yaxes and also set their sizes and top position.
I only used two series and code looks like this:
Chart chart = new Chart(ChartType.COLUMN);
Configuration conf = chart.getConfiguration();
conf.getChart().setAlignTicks(false);
conf.setTitle("");

XAxis x = new XAxis();
x.setCategories("Jan", "Feb", "Mar", "Apr", "May", "Jun", "Jul", "Aug",
        "Sep", "Oct", "Nov", "Dec");
conf.addxAxis(x);

YAxis y0 = new YAxis();
y0.setMin(0);
y0.setHeight("100");
y0.setTitle("Process Load");
conf.addyAxis(y0);

YAxis y1 = new YAxis();
y1.setMin(0);
y1.setTitle("Live Threads");
y1.setTop("200");
y1.setHeight("100");
y1.setOffset(0);
conf.addyAxis(y1);

ListSeries series0 = new ListSeries("Process Load", 49.9, 71.5, 106.4,
        129.2, 144.0, 176.0, 135.6, 148.5, 216.4, 194.1, 95.6, 54.4);
ListSeries series1 = new ListSeries("Live Threads", 83.6, 78.8, 98.5,
        93.4, 106.0, 84.5, 105.0, 104.3, 91.2, 83.5, 106.6, 92.3);
conf.addSeries(series0);
conf.addSeries(series1);
series1.setyAxis(y1);
I’m also attaching the output I got. One downside of this is that it looks like it requires absolute values for sizes.
Hope this helps!


