Hello experts,
I have a specification that need to combine and show spline chart and column chart, and the spline line needs to reach the end/right border of the chart. But I’m unable to achieve that even when I set a DataSeriesItem at max date value of XAxis. This only happens in combination of spline chart and column chart. If it is a standalone spline chart, everything is showing correctly. Am I missing any configuration ?
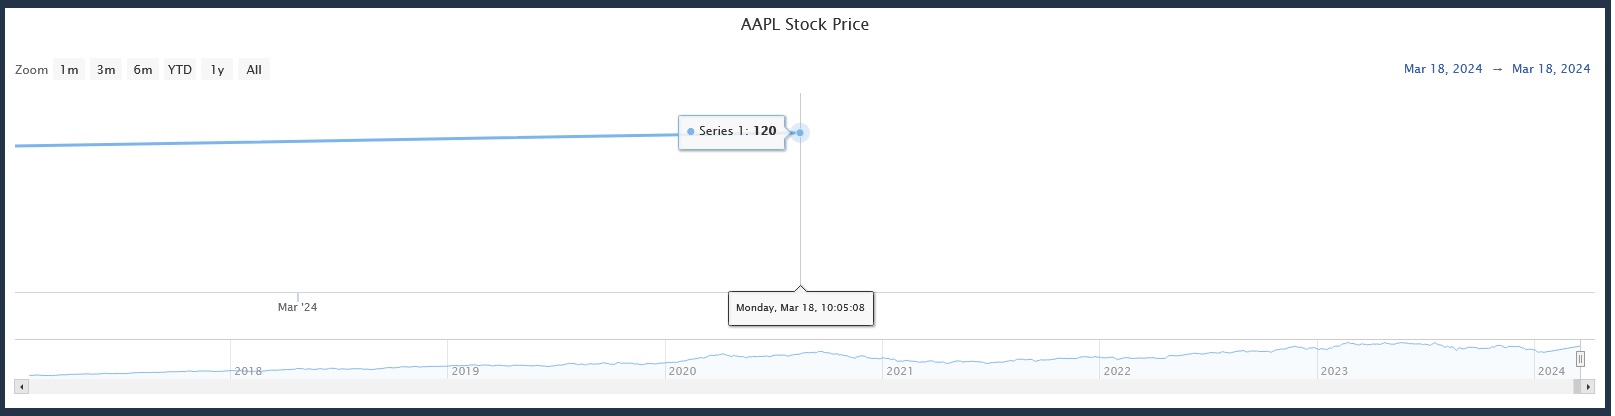
I created a sample of Vaadin 23 and 24, and got same problem
public class SplineView extends VerticalLayout {
    public SplineView() {
        Chart chart = new Chart(ChartType.SPLINE);
        chart.setTimeline(true);
        Configuration configuration = chart.getConfiguration();
        configuration.getTitle().setText("AAPL Stock Price");
        configuration.getTooltip().setEnabled(true);
        XAxis xAxis = configuration.getxAxis();
        xAxis.setType(AxisType.DATETIME);
        xAxis.setTickWidth(2);
        xAxis.setOrdinal(false);
        xAxis.setMax(Date.from(Instant.now()));

        YAxis columnYAxis = new YAxis();
        columnYAxis.setShowEmpty(false);
        columnYAxis.setVisible(false);
        configuration.addyAxis(columnYAxis);
        DataSeries dataSeries = new DataSeries();
        Random random = new Random();
        Map<Integer, DataSeries> multipleDataSeries = new HashMap();
        var stockPrices = StockPrices.fetchAaplPrice();

        for (var stock  : stockPrices) {
            StockPrices.PriceData data = (StockPrices.PriceData)stock.next();
            DataSeriesItem item = new DataSeriesItem();
            item.setX(Instant.ofEpochMilli(data.getDate()).plus(2920L, ChronoUnit.DAYS));
            item.setY(data.getPrice());
            dataSeries.add(item);
            Integer randomNumber = random.nextInt();
            DataSeries columnDataSeries;
            if (multipleDataSeries.containsKey(randomNumber)) {
                columnDataSeries = multipleDataSeries.get(randomNumber);
            } else {
                columnDataSeries = new DataSeries();
                PlotOptionsColumn plotOptionsColumn = new PlotOptionsColumn();
                plotOptionsColumn.setPointWidth(30);
                columnDataSeries.setPlotOptions(plotOptionsColumn);
                multipleDataSeries.put(randomNumber, columnDataSeries);
            }

            if (random.nextInt(100) < 10) {
                DataSeriesItem columnItem = new DataSeriesItem();
                columnItem.setX(Instant.ofEpochMilli(data.getDate()).plus(2920L, ChronoUnit.DAYS));
                columnItem.setY(data.getPrice());
                columnDataSeries.add(columnItem);
            }
        }

        DataSeriesItem nowItem = new DataSeriesItem();
        nowItem.setX(Instant.now());
        nowItem.setY(120);
        dataSeries.add(nowItem);
        configuration.addSeries(dataSeries);
        multipleDataSeries.values().forEach((s) -> {
            configuration.addSeries(s);
        });
        RangeSelector rangeSelector = new RangeSelector();
        rangeSelector.setSelected(1);
        configuration.setRangeSelector(rangeSelector);
        this.add(new Component[]{chart});
    }
}
Hi Herberts,
Thank you for helping on the issue. I added PointPlacement.ON to my chart, but it does not really solve the issue. If I set the Range selector to Day view, the last point still did not reach the end of the graph. One additional abnormal issue that I noticed is: if I drag and drop to change the date, the last point will reach the end and I can not drag to the future, but if I use the right scroll bar button, I still can extend the chart to few hours ahead last point. Do you think it is a bug ?
Sorry for not mentioned ealier that my main view is Day view. Here is the code that I updated
public class SplineView extends VerticalLayout implements IView {
    public SplineView() {
        Chart chart = new Chart(ChartType.SPLINE);
        chart.setTimeline(true);
        Configuration configuration = chart.getConfiguration();
        configuration.getTitle().setText("AAPL Stock Price");
        configuration.getTooltip().setEnabled(true);

        XAxis xAxis = configuration.getxAxis();
        xAxis.setType(AxisType.DATETIME);
        xAxis.setTickWidth(2);
        xAxis.setOrdinal(false);
        xAxis.setMax(Date.from(Instant.now()));

        YAxis columnYAxis = new YAxis();
        columnYAxis.setShowEmpty(false);
        columnYAxis.setVisible(false);
        configuration.addyAxis(columnYAxis);
        DataSeries dataSeries = new DataSeries();
        Random random = new Random();
        Map<Integer, DataSeries> multipleDataSeries = new HashMap();
        var fullStockPrices = StockPrices.fetchAaplPrice();
        var stockPrices = fullStockPrices.subList((fullStockPrices.size()/3)*2, fullStockPrices.size()-1);

        for (var stock  : stockPrices) {
            DataSeriesItem item = new DataSeriesItem();
            item.setX(Instant.ofEpochMilli(stock.getDate()).plus(2920L, ChronoUnit.DAYS));
            item.setY(stock.getPrice());
            dataSeries.add(item);
            Integer randomNumber = random.nextInt();
            DataSeries columnDataSeries;
            if (multipleDataSeries.containsKey(randomNumber)) {
                columnDataSeries = multipleDataSeries.get(randomNumber);
            } else {
                columnDataSeries = new DataSeries();
                PlotOptionsColumn plotOptionsColumn = new PlotOptionsColumn();
                plotOptionsColumn.setPointPlacement(PointPlacement.ON);
                plotOptionsColumn.setPointRange(30);
                plotOptionsColumn.setPointWidth(30);
                columnDataSeries.setPlotOptions(plotOptionsColumn);
                multipleDataSeries.put(randomNumber, columnDataSeries);
            }

            if (random.nextInt(100) < 10) {
                DataSeriesItem columnItem = new DataSeriesItem();
                columnItem.setX(Instant.ofEpochMilli(stock.getDate()).plus(2920L, ChronoUnit.DAYS));
                columnItem.setY(stock.getPrice());
                columnDataSeries.add(columnItem);
            }
        }

        DataSeriesItem nowItem = new DataSeriesItem();
        nowItem.setX(Instant.now());
        nowItem.setY(120);
        dataSeries.add(nowItem);

        configuration.addSeries(dataSeries);
        multipleDataSeries.values().forEach((s) -> {
            configuration.addSeries(s);
        });
        RangeSelector rangeSelector = new RangeSelector();
        final RangeSelectorButton btnDay = new RangeSelectorButton(RangeSelectorTimespan.DAY, 1, "Day");
        final RangeSelectorButton btnWeek = new RangeSelectorButton(RangeSelectorTimespan.WEEK, 1, "Week");
        rangeSelector.setEnabled(true);
        rangeSelector.setButtons(btnWeek, btnDay);
        rangeSelector.setSelected(1);
        configuration.setRangeSelector(rangeSelector);
        this.add(chart);
    }

}
I suspect there is some timezone conflict going on here.
If I add +2 hours to the ‘nowItem’, which is equivalent to my timezone (UTC+2), it does seem to go to the edge of the chart.
DataSeriesItem nowItem = new DataSeriesItem();
nowItem.setX(Instant.now().plus(2, ChronoUnit.HOURS));
Not completely sure how to work around this, but I think it might be enough for you to just remove the xAxis.setMax(..) to fit your use-case.