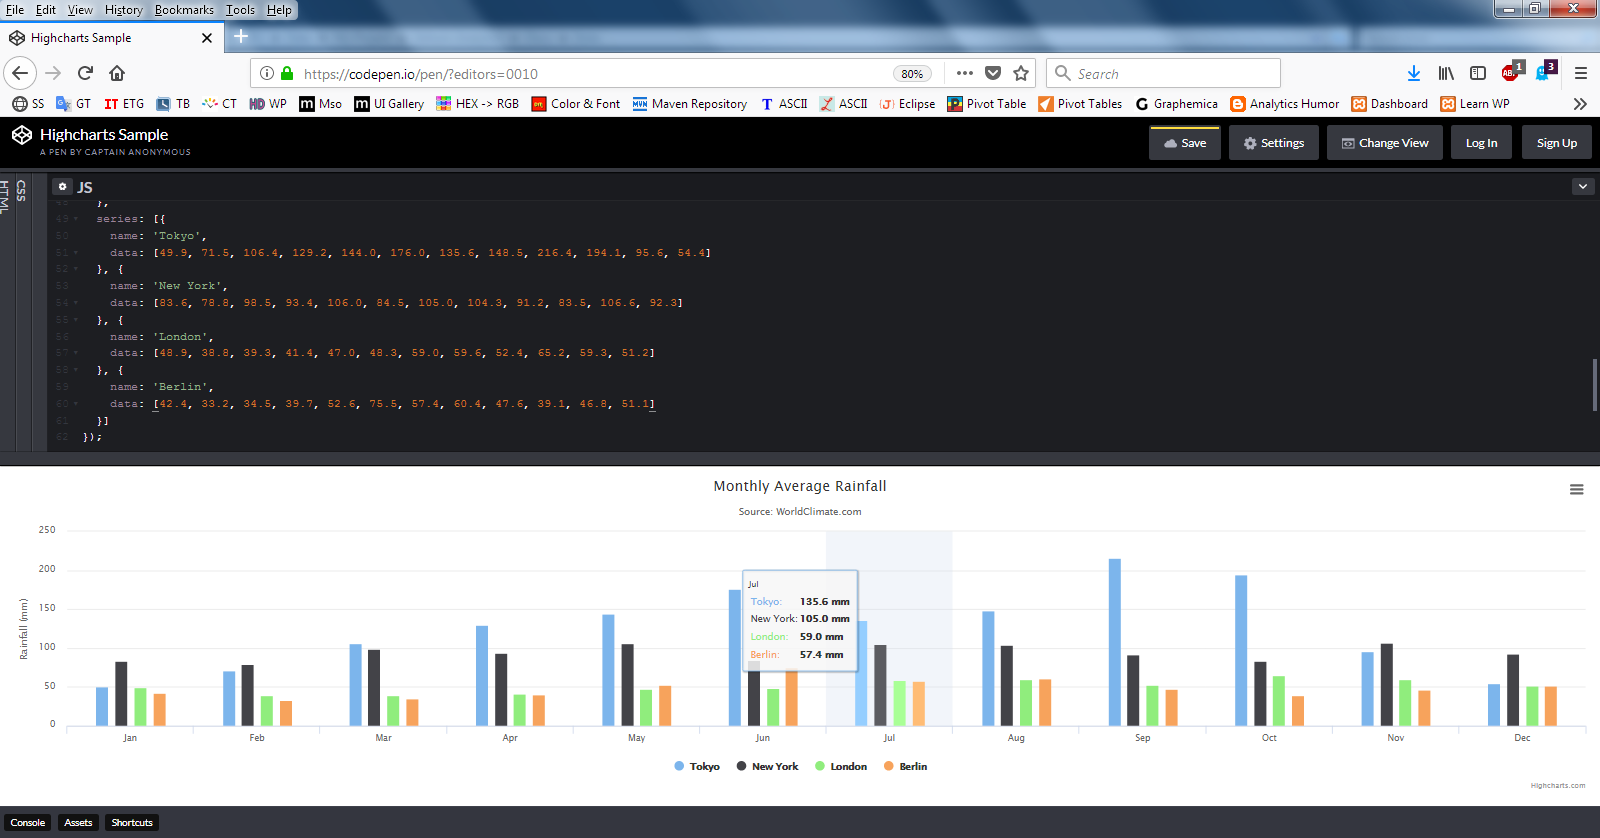
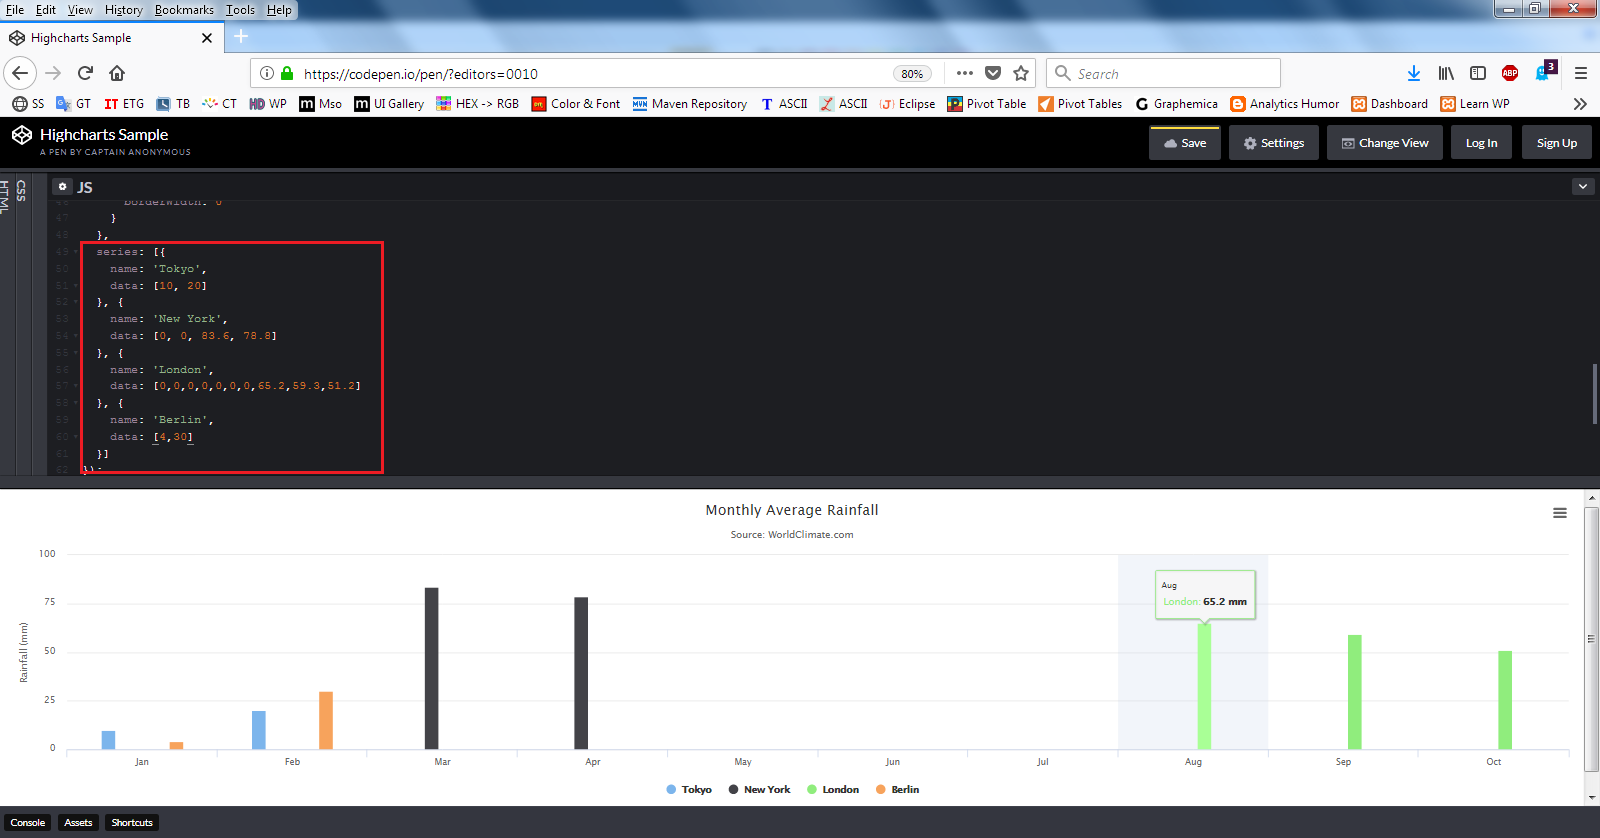
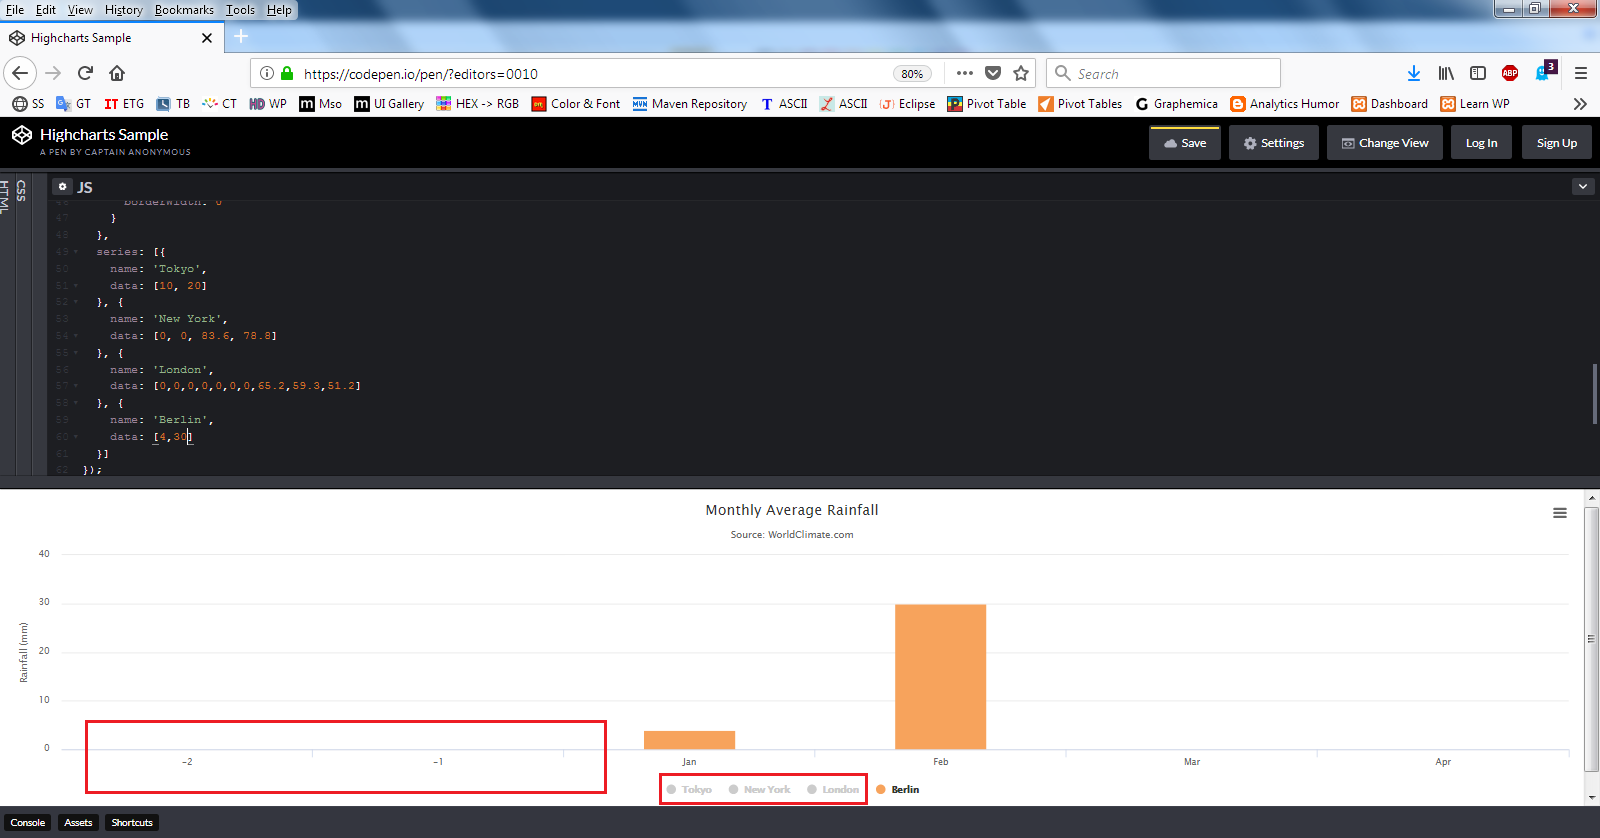
Hi…I am using Vaadin 10.0.0. In column chart, while hiding legends, if there is no value for X-axis for specific legend then it will show -1/-2/etc… on X-axis. To find the root cause, I checked in high charts and followed the link https://www.highcharts.com/demo/column-basic. I attached screen shots for better understanding the issue.
- Chart1.png is the original chart
- Chart2.png is with the modified data
- Chart3.png is the issue screen shot, i.e. if we hide legends(Tokyo,New York,London), it shows X-axis as -1/-2 etc.
Please advise.


