Hi,
i would like to use VisualVM to check whats going on with my vaadin app, where memory is used to heavily etc.
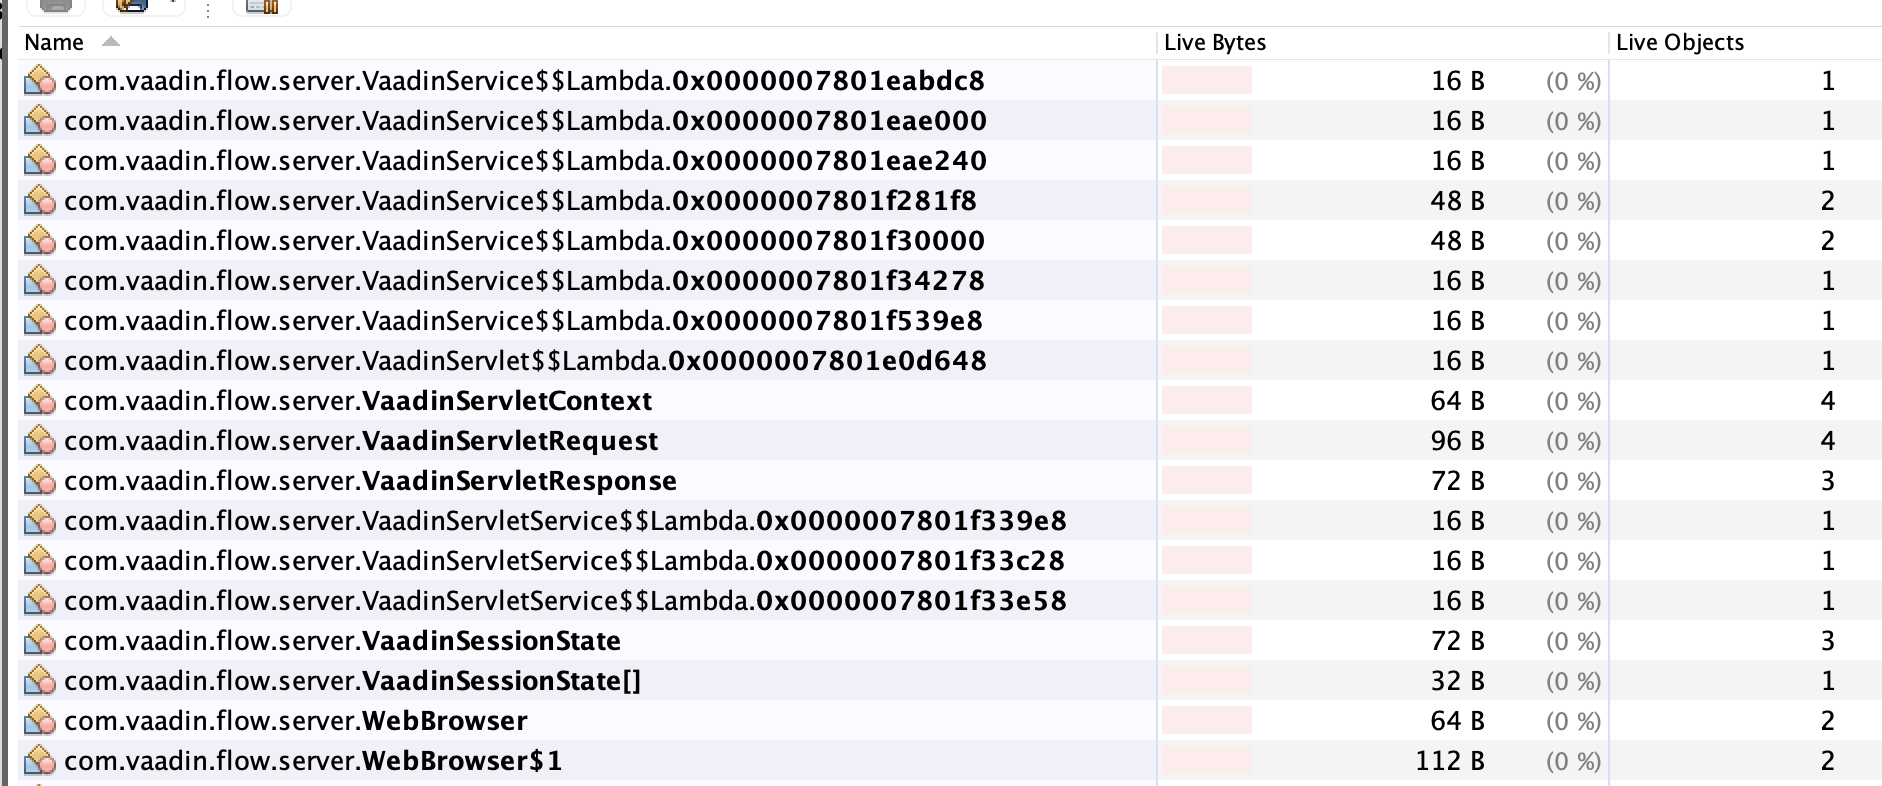
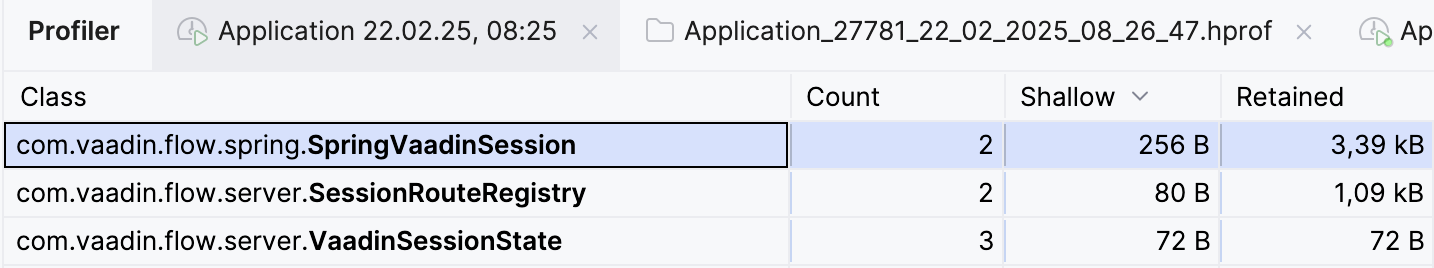
Does anyone has some classes which i need to monitor? For example i want to know how much memory per User Session gets allocated/consumed. There are tons of classes, but which one are the most important?
Looking forward to some experience of you guys :) Maybe visualVM isnt the best tool? Cant find a filter or anything like that
Will do so. That would be a great opportunity to get help by a AI which analyze the tons of classes which sounds so meaningless when opening a heap dump
Not necessarily. The tricky things with retained sizes is that it excludes anything that is also referenced through some other chain of references. So if you e.g. have some kind of shared event bus and that indirectly references some UI components, then those components together with anything they reference will not be included in the session’s retained size.
As a general rule of thumb, every component instance is between 100 and 1000 bytes plus any application data that they contain. In practice, this means that each user session would typically be in the range between 100 kb and 1 mb.
oh ok so a lets assume we have a view (page) with 5 vertical layouts, 5 buttons and some span etc. can i see how much this view needs? Are there “must do” to prevent using too much memory. of course i use lazy loading in grid or pagination, but maybe there are some more thing to think off.
when is the memory freed by vaadin/spring? With end of the session? Or are view specific data not saved per user session?
Memory is freed when objects are no more referenced: You remove a component from the UI, you navigate to another view or close the browser window (in some circumstances it may take time, namely with FF).
In many cases the memory is though somehow “shared”, e.g. some data structures may be shared between your components, views and even other users. Another thing that may complicate analysis is DI. At least at some point Vaadin UIs didn’t get all relevant objects in “retained size analysis” as some parts were referenced from the context.
In all analysis, run in production mode.
The best way get trustworthy numbers is to drive a number of session against the app and see how the session size grows.
You might find a fairly recent session of mine (1-3 years ) from YouTube about the topic. There I’m using VisualVM, which I have find good enough tool for its price point (if you have JProfiler, use that).
I’d claim the “lower range” of" typical “user session” by Leif is quite conservative (UIs without e.g. without Grid and similar data bound listing components) are quite light. And on the other hand, if you are lazy and don’t do lazy loading, it can easily be the size of your data(base), which is fine in many cases.
The typical user session has a Grid view open. Why should we count the the light views that users just quickly navigate away from?
The average memory use over all views might be lower but the average weighted by spent time is skewed towards those heavier views with Grid, ComboBoxes or Charts because that’s where the meaningful work happens.
If you use kubernetes-kit with Redis, you can get more or less exact numbers on how ‘big’ the session object is. We see session sizes averaging around 1.5-2MB. But, indeed as @Matti predicted, a view also once managed to stuff 50MB of data in the session. And this is problematic.
It’s a bit of a grey area in Vaadin I feel, even though a healthy http session is crucial for keeping production apps running. But in the framework itself there is very little allowing visibility on the session. I would want developers to see during development how much memory a specific view adds to the session, and things like memory increase when a grid loads its data. Some micrometer things tracking session sizes etc.
It depends highly on the number of users and what they are doing (and course the size of the view they are browsing). If nobody is using a huge view that consumes a lot of memory then the memory consumption has almost no impact.
In a hobby app of mine with largest spikes in its usage, most of the users use a form, custom tailored for them. No grid or other large dataset there. The session size there is closer to 10k than 100k.
Views built around Grid are indeed rather common, especially on admin UIs where the sessions/time on views are long. But I’d be ready to claim it is not the default in views where their might be largest user spikes and this way being the ones people have most concerns about. That’s why drawing that kind of examples larger than they can very well be is not very good for the popularity of the framework. Also for example in “Liukuri”, the view that people use is essentially a dashboard, whose memory usage can be quite minimal, especially if using the correct chart library ;-)
As a comment to Jorg’s comment, in many apps even 50MB is not a problem at all. With a moderate 2GB server one can host dozens of such monster sessions of concurrent users. Memory can be a big enabler, making things a lot simpler and faster. But it sure can become a problem at that scale if one uses persisted sessions, e.g. saving them in Redis. But that is the option I think one shouldn’t pick lightly.
Here is one article where I present some hints how to do this kind of estimations. But as discussed here and in the article, it really depends about your app and how it is built & hosted. I can give you an educated guess that if you don’t deploy on toy server (e.g. one with 256MB memory), don’t waste your memory somehow (like loading full data base tables to the memory for each user), your relational database (and how you use it) will be first real scalability issue, not server memory.
I would claim that your examples are not typical Vaadin applications and we could keep arguing back and forth about that for a long time.
But I think the main point here is that there’s never any universal truths when it comes to performance. You always have to measure and evaluate based on your own application.
Memory can be a big enabler, making things a lot simpler and faster. But it sure can become a problem at that scale if one uses persisted sessions, e.g. saving them in Redis. But that is the option I think one shouldn’t pick lightly.
With full hindsight yes, persisted sessions pose a noticeable burden on the development cycle. But in order to guarantee some degree of availability you just can’t get around them. Sure we can think of finicky deployment pipeline tricks but those are equally burdensome.
In our corporate internal app we have regurlarly about 70 concurrent users and a JVM memory consumption of about 2GB RAM. Our App runs on Vaadin 24 / Spring boot with “heavy” views and a lot of components and of course the fetched and displayed data. These values only spike up when users request vaadin charts to draw data with several drill down levels.
I did many load tests of Vaadin applications (mostly ERP systems) and the problem was always the usage of the database and the number of database sessions.
Also be careful when using a background job that pushes to the UI.