For me it looks like Vaadin internals
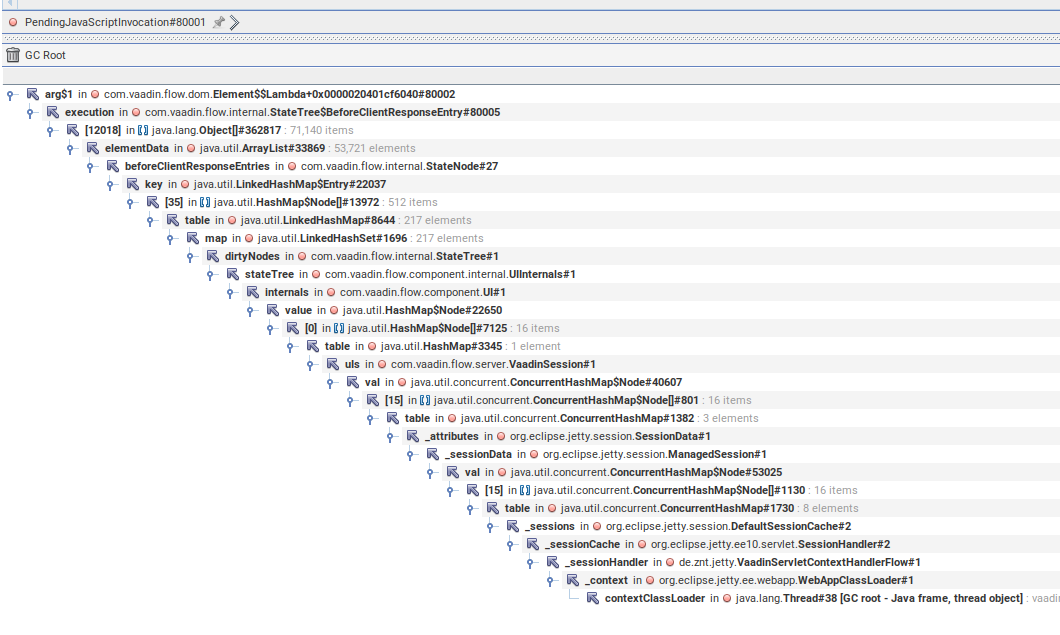
It could be, but there is not enough information on this thread to understand the reason of the leak.
There are still pending questions:
- which components are scheduling the js invocation?
- why so many of them? What part of the application causes such a huge numbers of pending js executions?
- are the HTTP session properly expiring?
- are there any software compo other than HTTP session holding vaadin session references?
If all the UI and sessions are active, it could also not be a leak but an expected behavior caused by the application operating on hidden components on a high frequency (push from background threads)
So, unfortunately, without analyzing some full dumps and looking at the application code, I don’t have any other suggestions.
This looks like something keeps running executeJs against a component in some UI. Those executions keep piling up because there’s no active push connection (or the push connection is broken). In that scenario, the changes can be delivered to the client only the next time that client sends a request to the server. If no such request comes, then the pending invocations will indeed just keep piling up until the session is expired.
The actual problem is that there’s something that keeps triggering those executions. The solution is to find what that is, which you can probably do by looking at the contents of a sample of those PendingJavaScriptInvocation instances.
I can reproduce the exact same symptoms with this simple example view.
@Route
public class Invocations extends VerticalLayout {
    public Invocations() {
        UI ui = UI.getCurrent();

        add(new Checkbox("Push enabled", ui.getPushConfiguration().getPushMode() == PushMode.AUTOMATIC, event -> {
            ui.getPushConfiguration().setPushMode(event.getValue() ? PushMode.AUTOMATIC : PushMode.DISABLED);
        }));
        add(new Button("Schedule invocations", click -> {
            Thread.startVirtualThread(() -> {
                for (int i = 0; i < 10000; i++) {
                    execute(ui, i);
                }
            });
        }));
        add(new Button("Empty round trip", click -> {
        }));
    }

    private void execute(UI ui, int i) {
        ui.access(() -> getElement().executeJs("console.log($0)", i));
    }
}
If I click the schedule button with push enabled and then get a heap dump, then I will have exactly 10000 instances of BeforeClientResponseEntry, Element$$Lambda+0x00000078018ad448, PendingJavaScriptInvocation and UIInternals$JavaScriptInvocation. If I then click the empty round trip button and check the heap again, then all the instances are gone. If I have push enabled, then the instances won’t be there.
My scenario looks like this: I have some TextFields that are bound to Binder objects and some background task that updates the corresponding beans about every 5 seconds.
The question is why are the requests not processed … Normally, when the session is closed, the server side should stop sending update requests to the browser…
What can cause a push connection to be broken?
My push configuration:
@Push(value = PushMode.AUTOMATIC, transport = Transport.WEBSOCKET_XHR)
@Viewport("width=device-width, minimum-scale=1.0, initial-scale=1.0, user-scalable=yes")
public class UIFlowShellConfigurator
    implements AppShellConfigurator
You mean with push disabled …
1 Like
Server-side UI instances are not always closed immediately when the user closes the tab. As a very tangible example, a view with @PreserveOnRefresh is kept in memory because there’s no way to detect the difference between closing the tab and reloading it other than waiting to see if the same URL is loaded again from the same browser window. The end result is the same in that case: scheduled changes keep piling up while waiting for a way of delivering them to the client. There are also some other similar scenarios where cleanup only happens after a timeout.
I’m afraid there’s no good built-in way of directly checking whether changes are piling up for a UI. Maybe we should add an API that applications can use to check that before trying to apply more changes.
As a workaround, you can use UI::beforeClientResponse to register a callback that is run the next time changes are about to be sent to the client. You can then set a flag the first time you submit changes for a client along with a before client response handler that clears the flag. Subsequent updates from the background job can then be ignored if the flag hasn’t been reset.
Is there any timeout configuration that can speed up detecting whether the push connection is broken? I don’t understand why the memory is slowly and constantly growing… Usually it must come down after the connection times out…
Inactive UIs are eligible for closing after missing three heartbeats from the client. Eligible UIs are not cleaned up immediately but there’s instead logic in VaadinService::requestEnd that looks through the session for UIs that should be closed due to inactivity. This should happen regularly as long as there’s at least one remaining UI since heartbeat requests also go through the same code path. If no UI is active, then cleanup happens only based on the regular session timeout configured through the servlet container.