Hi,
Vaadin version is 24.9.12. I get a huge amount of PendingJavaScriptInvocation objects. The number of objects increases slowly until it gets to OOM.
Any tips for me? Is it maybe a setting missing?

Hard to say without further information.
Did you notice this behavior after upgrading from an older Vaadin version?
Or is it a new project that shows the problem from the beginning?
If you inspect the heap dump object, could you see any references to which Javascript expression is pending?
New project, it uses jetty 12.1.6
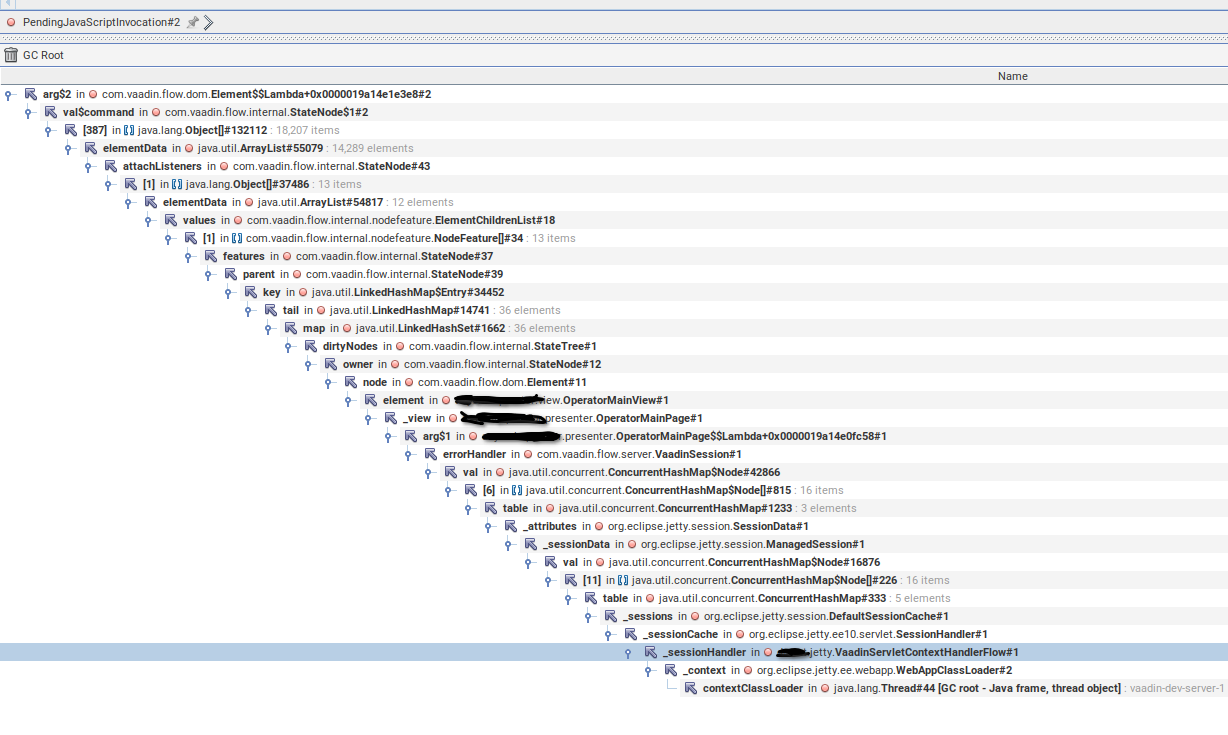
Can you describe what OperatorMainPage and OperatorMainView do? Are you using executeJS by your own? Any third party add-ons?
Also, do you have a custom ErrorHandler? It looks like it is keeping a reference to OperatorMainPage (if I read the stack correctly)
I will have to take a look at what the classes are doing. I have seen that in the past there were some problems with PendingJavaScriptInvocations, and I was not sure whether they were fixed in 24.9.12.
AFAIK, all reported PendingJavaScriptInvocations memory leaks have been fixed in Vaadin 24 or previous versions.
I have found something like this in OperatorMainPage VaadinSession.getCurrent().setErrorHandler((ErrorHandler) errorEvent -> { logger.error("Uncaught UI exception", errorEvent.getThrowable()); Notification.show("We are sorry, but an internal error occurred"); });
Is it something potentially wrong with the code?
I’m not sure, but I’m guessing the Notification is not getting created in a UI thread, which causes an exception, which then gets back to this error handler in an infinite loop
Thanks, I can try to reproduce this
I can confirm that Notification.show won’t work without an existing / current UI at least. It uses a controller that effectively runs this: flow-components/vaadin-flow-components-shared-parent/vaadin-flow-components-base/src/main/java/com/vaadin/flow/component/shared/internal/OverlayAutoAddController.java at c7fee8085d67a5662278b0721731ae6158eeb777 · vaadin/flow-components · GitHub
The Notification is created and shown, the PendingJavaScriptInvocations objects are GC’ed
IIRC, ErrorHandler is always invoked in a UI thread.

Unfortunately, it’s almost impossible to help just looking at the screenshot. Did you already tried to analyze the heap dump with tools like eclipse MAT?
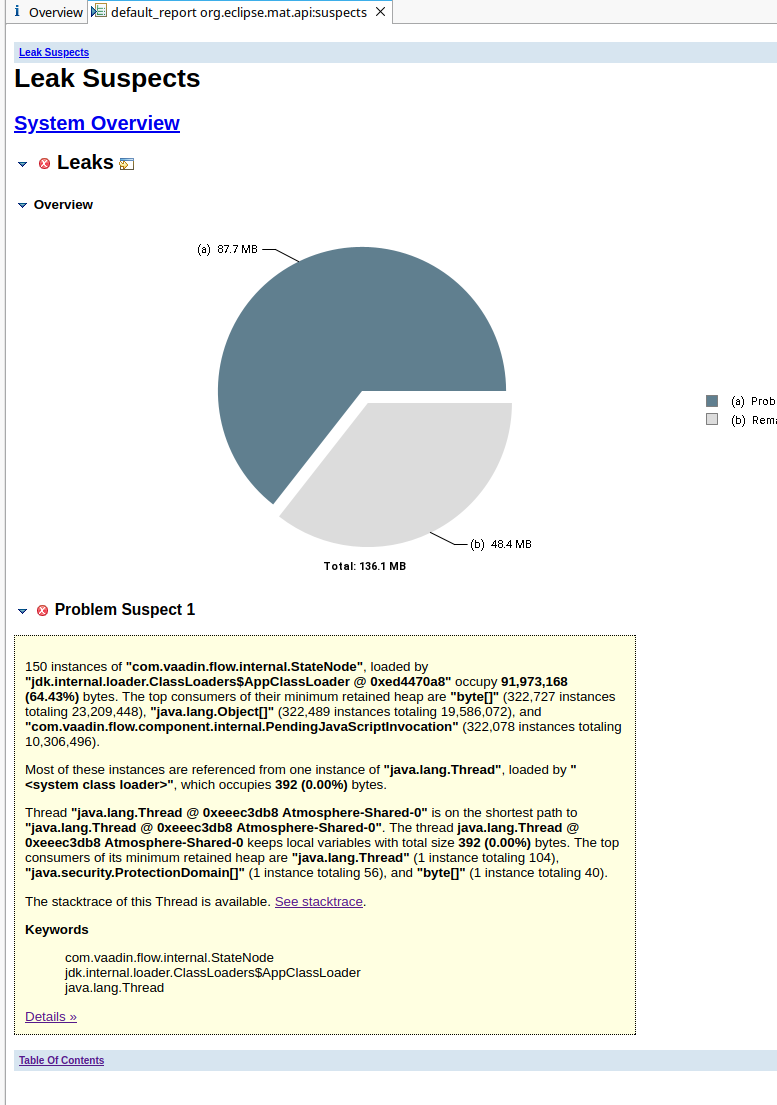
This report mentions Atmosphere. Do you have background threads that frequently push changes to the UI?
Would you be able to share the whole code on OperatorMainPage and OperatorMainView?
Actually, there are a lot of threads updating the UI. I have this configuration
@Push(value = PushMode.AUTOMATIC, transport = Transport.WEBSOCKET_XHR)
@Viewport("width=device-width, minimum-scale=1.0, initial-scale=1.0, user-scalable=yes")
public class UIFlowShellConfigurator
    implements AppShellConfigurator