This thread is about the add-on
Highcharts for Vaadin 7
.
Please let me know if you have any problems with the add-on or suggestions.
This thread is about the add-on
Highcharts for Vaadin 7
.
Please let me know if you have any problems with the add-on or suggestions.
I can’t see the default button to export. my java @JavaScript(…) defnition:
@JavaScript({“library/jquery.min.js”, “library/highcharts-connector.js”, “library/highcharts.js”, “library/modules/exporting.js”, “library/modules/exporting.src.js”})
First of all, you don’t need to import “exporting.src.js”. It’s probably not conflicting but it’s not necessary if you import “exporting.js”.
I tested the exporting module right now in my demo application and it worked. I can see the export button.
Please make sure that the exporting.js is also copied to your webapp directory accessed by your servlet container.
For my demo project I’m using the script “scripts/copyResources.sh” which does this job for me. It just copies the resources in my src directory to the tomcat webapp directory. If you don’t want to copy the files manually or via a script you can also rebuild the whole project with “mvn clean package”. That should also copy all resources to the right place. However, it will also rebuild the whole widgetset which might take a while.
I don’t know which is the best place to ask questions.
Just asked this on add-on forum.
Hi Stefan,
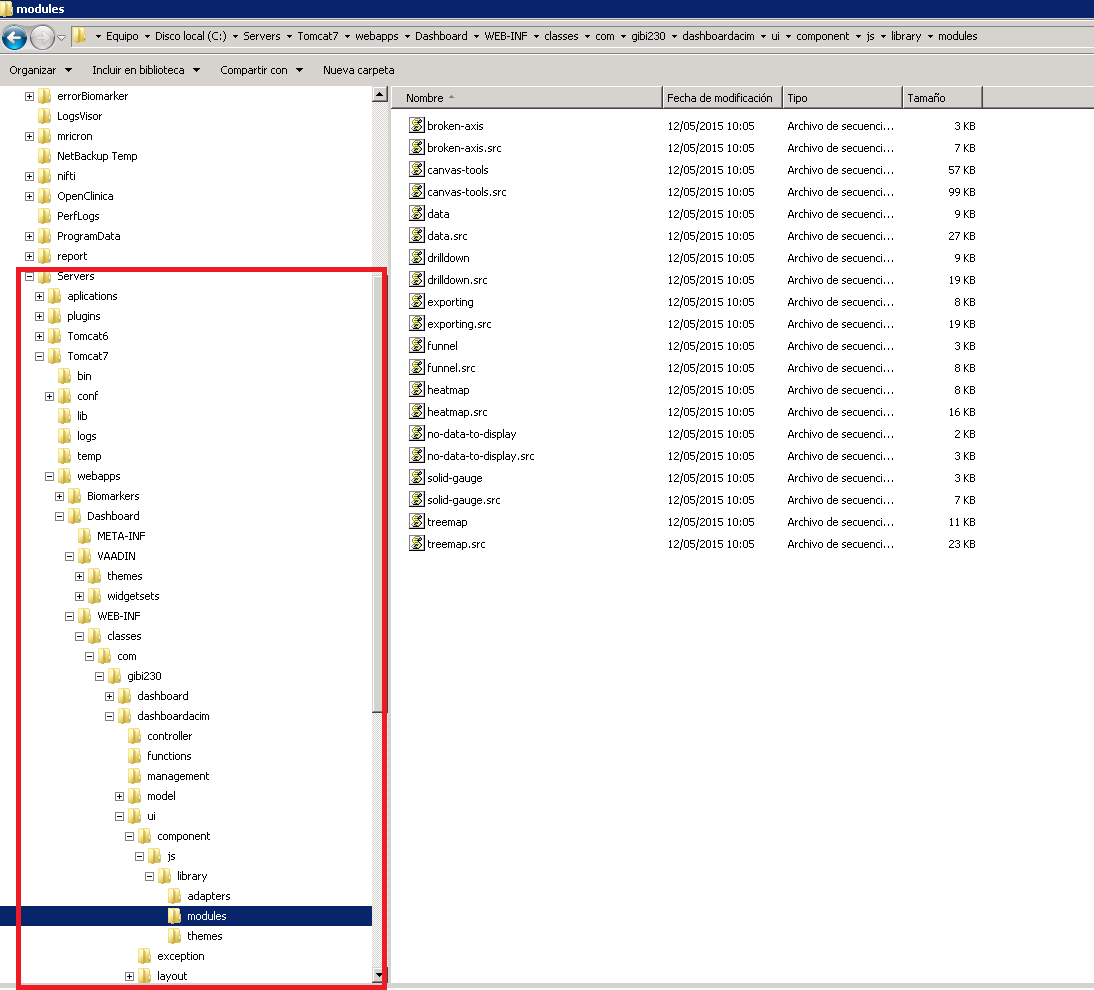
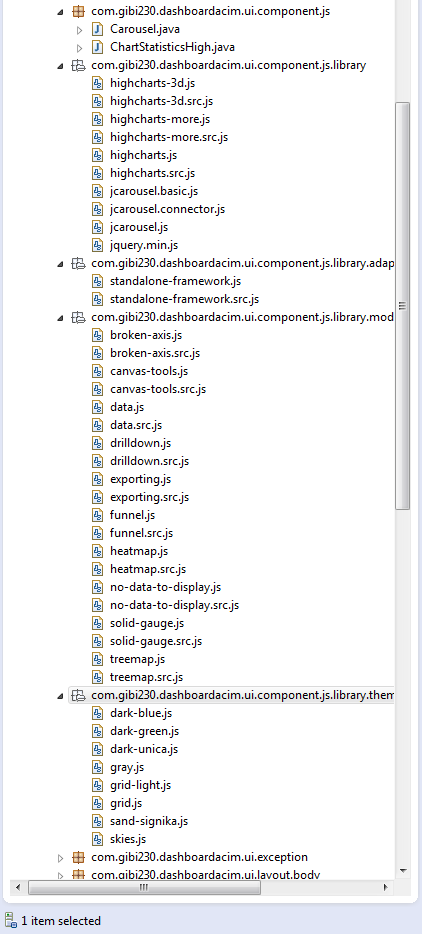
I can not see the export button In online demo (https://endrullis.de/highcharts-vaadin7/). I attached two images. The first image is my eclipse, where you can see the highchart js that’s including in my project. The second image is the tree folder of server web. it’s allright¿? Moreover I rebuilt the widgetset, however continues without to run.


Hi Enrique,
I did not upload the change to github and did not change the demo instance. However, I think I found the problem: You changed the package name of the component, but you still inlude “library/highcharts-connector.js” which is actually located in the package org.vaadin.highcharts and comes with the plugin. To solve it you could either move your Highcharts class and all Highcharts js files to org.vaadin.highcharts or copy the highcharts-connector.js from the plugin to your package (library directory), because I think that vaadin does not accept absolute paths in the @JavaScript annotation (that was at least the case for vaadin 7.3).
Well this is most simple, i don’t have file “highcharts-connector.js”!!! What does the file has to include?
It’s part of the add-on:
highcharts-connector.js
Hi Stefan,
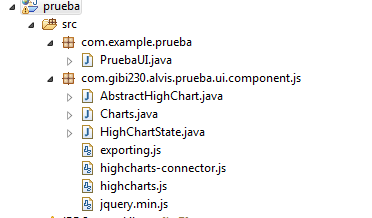
i create a simple project, you can see the architeture in attached file. Where file connector is copy-paste of original.
[code]
window.com_gibi230_alvis_prueba_ui_component_js_AbstractHighChart = function () {
this.onStateChange = function () {
    // read state
    var domId = this.getState().domId;
    var hcjs = this.getState().hcjs;

    // evaluate highcharts JS which needs to define var "options"
    eval(hcjs);

    // set chart context
    $('#' + domId).highcharts(options)
};
};
[/code]And file Charts.java:
package com.gibi230.alvis.prueba.ui.component.js;
import org.vaadin.highcharts.HighChart;
import com.vaadin.annotations.JavaScript;
@JavaScript({"jquery.min.js","highcharts.js", "exporting.js", "highcharts-connector.js"})
public class Charts extends AbstractHighChart{
    private static final long serialVersionUID = -7326315426217377753L;

    public HighChart getDeviceBenchmark() {

        HighChart deviceBenchmark = new HighChart();
        deviceBenchmark.setHcjs("var options = {"
                    + "chart: {type: 'bar'},"
                    + "title: {text: 'Antutu'},"
                    + "xAxis: {categories: ['Meizu MX4','Google Nexus 6','Samsung Galaxy Alpha', 'Samsung Galaxy Note 4',"
                        + "'OnePlus One','Xiaomi Mi4','HTC One M8','Xiaomi Redmi 2']},"
                    + "series: [{name: 'Puntuación',data: [47765,47079,45817,44669,44156,42460,42039,22587]
}],"
                    + "legend: {enabled: false}"
                + "};");
        return deviceBenchmark;
    }
}
However I can’t see export button :(((

Hello …
i found problem when create testing of other project for testing Highcharts
[WARNING]
FAILED org.eclipse.jetty.server.session.SessionHandler@d93621: java.lang.IllegalStateException: Multiple servlets map to path: /: AmlUIServlet,org.vaadin.highcharts.demo.DemoUI$Servlet
java.lang.IllegalStateException: Multiple servlets map to path: /: AmlUIServlet,org.vaadin.highcharts.demo.DemoUI$Servlet
why jetty failed Multiple servlets map to path: /*
What should I do?
Many Thanks
It looks like you copied the DemoUI to a project which had already a Servlet mapped on path /*.
You cannot run multiple serlvets / vaadin apps under the same path. Look for
@WebServlet(value = “/*”, asyncSupported = true) annotations and change the path so that both servlets have different ones.
It looks like you copied the DemoUI to a project which had already a Servlet mapped on path /*.
You cannot run multiple serlvets / vaadin apps under the same path. Look for
@WebServlet(value = “/*”, asyncSupported = true) annotations and change the path so that both servlets have different ones.
Hi Stefan,
Yes it is correct
i changed @WebServlet of default to @WebServlet(urlPatterns = { “/aml/" , "/VAADIN/” }, name = “AmlUIServlet”, asyncSupported = true)
then test and work perfect.
Many Thanks
Hi,
is it possible to draw a Spiderweb chart with this addon?
Hi,
is it possible to draw a Spiderweb chart with this addon?
Yes, but you need to include highcharts.js as well as highcharts-more.js for this.
An example of a highcharts spider web chart can be found here: http://www.highcharts.com/demo/polar-spider
Thank you for your answer Stefan.
I know that example on highcharts.com website, but what’s the code that should be used?
Here is the code from highcharts.com:
$(function () {

    $('#container').highcharts({

        chart: {
            polar: true,
            type: 'line'
        },

        title: {
            text: 'Budget vs spending',
            x: -80
        },

        pane: {
            size: '80%'
        },

        xAxis: {
            categories: ['Sales', 'Marketing', 'Development', 'Customer Support',
                    'Information Technology', 'Administration'],
            tickmarkPlacement: 'on',
            lineWidth: 0
        },

        yAxis: {
            gridLineInterpolation: 'polygon',
            lineWidth: 0,
            min: 0
        },

        tooltip: {
            shared: true,
            pointFormat: '<span style="color:{series.color}">{series.name}: <b>${point.y:,.0f}</b><br/>'
        },

        legend: {
            align: 'right',
            verticalAlign: 'top',
            y: 70,
            layout: 'vertical'
        },

        series: [{
            name: 'Allocated Budget',
            data: [43000, 19000, 60000, 35000, 17000, 10000]
,
            pointPlacement: 'on'
        }, {
            name: 'Actual Spending',
            data: [50000, 39000, 42000, 31000, 26000, 14000]
,
            pointPlacement: 'on'
        }]

    });
});
Here is the code of your online demo:
[code]
var options = {
title: {
text: ‘test diagram’
},
series: [
{
name: ‘s1’,
data: [1, 3, 2]
    },
    {
        name: 's2',
        data: [2, 1, 3]

    }
]
};
[/code]which does not contain the chart “type”
The argument that you would normally pass over to the function
$(‘#container’).highcharts(…)
has to be assigned to the variable
options
for my add-on.
Thus, your highcharts code would look like:
var options = {
        chart: {
            polar: true,
            type: 'line'
        },
        title: {
            text: 'Budget vs spending',
            x: -80
        },
        pane: {
            size: '80%'
        },
        xAxis: {
            categories: ['Sales', 'Marketing', 'Development', 'Customer Support',
                    'Information Technology', 'Administration'],
            tickmarkPlacement: 'on',
            lineWidth: 0
        },
        yAxis: {
            gridLineInterpolation: 'polygon',
            lineWidth: 0,
            min: 0
        },
        tooltip: {
            shared: true,
            pointFormat: '<span style="color:{series.color}">{series.name}: <b>${point.y:,.0f}</b><br/>'
        },
        legend: {
            align: 'right',
            verticalAlign: 'top',
            y: 70,
            layout: 'vertical'
        },
        series: [{
            name: 'Allocated Budget',
            data: [43000, 19000, 60000, 35000, 17000, 10000]
,
            pointPlacement: 'on'
        }, {
            name: 'Actual Spending',
            data: [50000, 39000, 42000, 31000, 26000, 14000]
,
            pointPlacement: 'on'
        }]
};Thank you Stefan it works ![]()
Another question:
I use Eclipse with Vaadin plugin, where should I put .js files?
Should I modify anything on the project?
I see that now web.xml is flagged on Eclipse as with errors, even if I didn’t change anything on it, but I copied .js files and HighCharts.java on Java Resources → src → org.vaadin.highcharts
I cannot say much about Eclipse since I don’t use it. If you are using maven or Intellij IDEA you have to put the .js files into the right package under resources. Actually, in IDEA you do not have to set anything up. You can just open the maven project and you’re done. But I heared that Eclipse might not have such a good maven support yet.?
The solution seems to be this:
Put javascript files on WebContent/VAADIN/js
Make HighChart.java as follow:
@JavaScript({"vaadin://js/jquery-1.7.1.min.js", "vaadin://js/highcharts.js", "vaadin://js/highcharts-more.js", "highcharts-connector.js"})
public class HighChart extends AbstractHighChart {
    private static final long serialVersionUID = -7326315426217377753L;
}
Edit:
web.xml has become red flagged again! ![]()
Hy, how do I use a 3D Graphic? A 2D one works fine, but if I am trying to use any 3D Graphic, I get always only a 2D one?
I am using Vaadin 7