Hi there,
first of all - gooood job! I managed to use ith with Vaadin 17 without any problems.
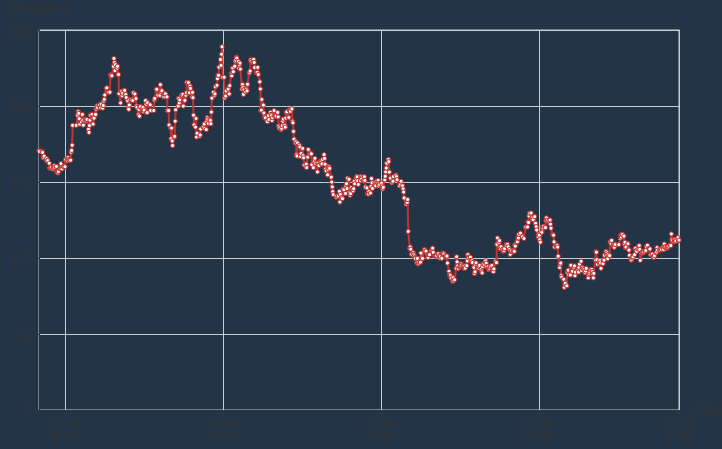
One thing I am struggling with is: How do I set the colors of a line of say a LineChart? If I have a black (or dark background) the default color of “red” is not so easy to spot.
Hi,
The data on the axis and the data type should be matching. (Currently, it won’t show any errors for the mismatch). Please see the X-axis in the sample below:
// Generating some random values for a LineChart
Random random = new Random();
TimeData xValues = new TimeData(); // Time data for the X-axis
LocalDateTime time = LocalDateTime.now();
Data yValues = new Data();
for(int x = 0; x < 40; x++) {
    time = time.plusSeconds(x);
    xValues.add(time);
    yValues.add(random.nextDouble());
}
xValues.setName("X Values");
yValues.setName("Random Values");

// Line chart is initialized with the generated XY values
LineChart lineChart = new LineChart(xValues, yValues);
lineChart.setName("40 Random Values");

// Line chart needs a coordinate system to plot on
// We need Number-type for both X and Y axes in this case
XAxis xAxis = new XAxis(DataType.TIME); // X-axis type is time.
YAxis yAxis = new YAxis(DataType.NUMBER);
RectangularCoordinate rc = new RectangularCoordinate(xAxis, yAxis);
lineChart.plotOn(rc);
thanks, well they do - I checked that the labels (ticks) are displayed - the problem was red on an almost black background) - so that works. However: How do I change the color/style(thickness) of a line? I just can’t see an option in the LineChart object.
There is a new version released for this. Sorry, I am looking into these missing pieces when someone really wants it only.
In the Chart class, there is a generic setColors(..) method that can be used to set colors to be used in that chart (some charts require more colors - example: PieChart). Also, in the LineChart class, you have methods for setting Line Style and Area Style. So, you can have finer control over such features. For example, if you want to set the line color and line width, do something as follows:
Just one cave at: setColor() sets the color of the line, of the PointSymbol and of the Legend. The color setting in LineStyle sets only the line color itself. The PointSymbol and the Legend remain at the default color!
I tried a few things with the DataZoom - creating it is no problem (Using RectangularCoordinates and an Axis) - then “show” but to no avail. How do I get the DataZoom to be displayed beneath the chart?
If you set the color on the chart itself, that will be used for the Point Symbol and the Legend. lineChart.setColor(...); lineChart.getLineStyle(true).setColor(...) will set the color for the line.
Point Symbols are the real values of the chart and legend is internally connected to the Point Symbols.
You can simply add the DataZoom instance to the SOChart instance. (There was a bug and is fixed in version 0.1.0 now).
// Generating some random values for a LineChart
Random random = new Random();
Data xValues = new Data(), yValues = new Data();
for(int x = 0; x < 40; x++) {
    xValues.add(x);
    yValues.add(random.nextDouble());
}
xValues.setName("X Values");
yValues.setName("Random Values");

// Line chart is initialized with the generated XY values
LineChart lineChart = new LineChart(xValues, yValues);
lineChart.setName("40 Random Values");

// Line chart needs a coordinate system to plot on
// We need Number-type for both X and Y axes in this case
XAxis xAxis = new XAxis(DataType.NUMBER);
YAxis yAxis = new YAxis(DataType.NUMBER);
RectangularCoordinate rc = new RectangularCoordinate(xAxis, yAxis);
LineStyle lineStyle = lineChart.getLineStyle(true);
Color color = new Color("#0000FF");
lineChart.setColors(color);
lineStyle.setWidth(6);
lineChart.getAreaStyle(true).setColors(new Color("#33440A"));
lineChart.plotOn(rc);
lineChart.getPointSymbol(true).setSize(8);
DataZoom dataZoom = new DataZoom(rc, xAxis);

// Add to the chart display area with a simple title
soChart.add(lineChart, dataZoom, new Title("Sample Line Chart"));
Your speed is impressive! Thank You. But unfortunately there’s still a bug in the DataZoom: The rangeMode has two “value” elements. The first value has no ending "…