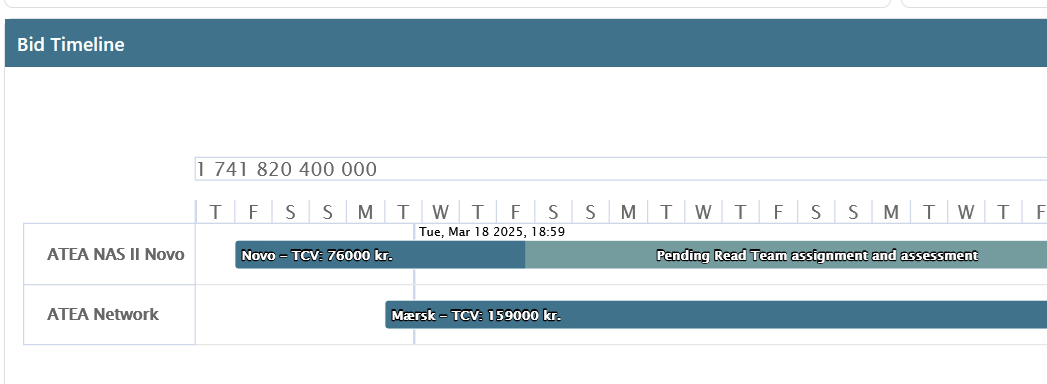
There seem to be a bug in the GANTT chart when trying to add a DAY timescale.
I can combine week and month, but day and week goes wrong.
Here is the important code :
private void configureYearsMonthsWeeksOnXAxis(Configuration configuration) {
	configureDaysAxis(configuration);
	configureWeeksAxis(configuration);
	// configureMonthsAxis(configuration);
}

private void configureDaysAxis(Configuration configuration) {
	XAxis axis = new XAxis();
	configuration.addxAxis(axis);
	axis.setMinPadding(0.05);
	axis.setMaxPadding(0.05);
	axis.setUnits(new TimeUnitMultiples(TimeUnit.DAY, 1));

	final Labels labels = new Labels();
	labels.setPadding(1);
	labels.setAlign(HorizontalAlign.CENTER);
	var style = new Style();
	style.setFontSize("16px");
	labels.setStyle(style);
	axis.setLabels(labels);

	axis.setGrid(new AxisGrid());
	axis.getGrid().setCellHeight(20);
}

private void configureWeeksAxis(Configuration configuration) {
	XAxis axis = new XAxis();
	configuration.addxAxis(axis);
	axis.setMinPadding(0.05);
	axis.setMaxPadding(0.05);
	axis.setUnits(new TimeUnitMultiples(TimeUnit.WEEK, 1));

	final Labels labels = new Labels();
	labels.setPadding(1);
	labels.setAlign(HorizontalAlign.LEFT);
	var style = new Style();
	style.setFontSize("16px");
	labels.setStyle(style);
	axis.setLabels(labels);

	axis.setGrid(new AxisGrid());
	axis.getGrid().setCellHeight(20);
}