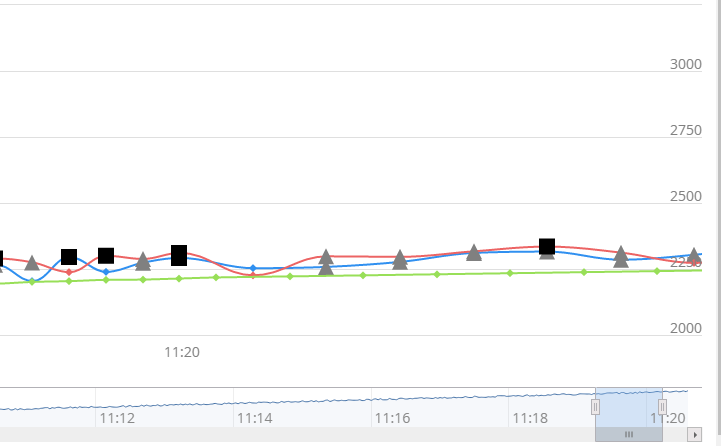
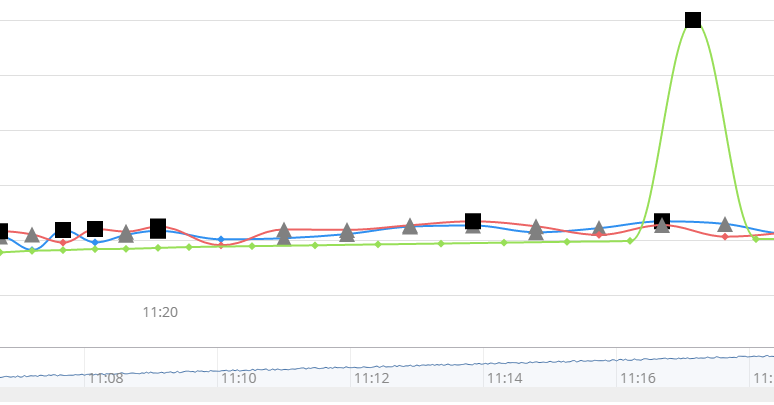
So currently I have 3 dataseries within my chart which has the Timeline option set to true.
I also have new dataseriesitems being added into each of the series every few seconds.
Everything seems to work fine, the chart grows to the right to show the new points being inserted, but when I
click on the first series on the legend to have its visibility removed, the chart stops shifting. If I manually click
and drag the chart to the right I can see the new points that have been added. When I click on the first series
in the legend again to have its visibility returned, the chart starts to move to show the new dataseriesitems.
It seems to only be a problem with the first series on the list, removing the second or third series doesn’t stop
the chart from shifting and showing the new values. I’ve tried switching around the order in which they were
added to the chart and it’s whichever series happens to be first on the legend list.
Is this expected behavior? Not sure if there’s some setting that’s causing this or if this is a bug in vaadin.
Thank you

