I’m quite clueless when it comes to Charts, even their styling. So I’m not sure I can help much. But I’m still interested in learning how you want to customize the styling of the Gantt chart. Can you share a design or a screenshot what you’re aiming for, or using as inspiration?
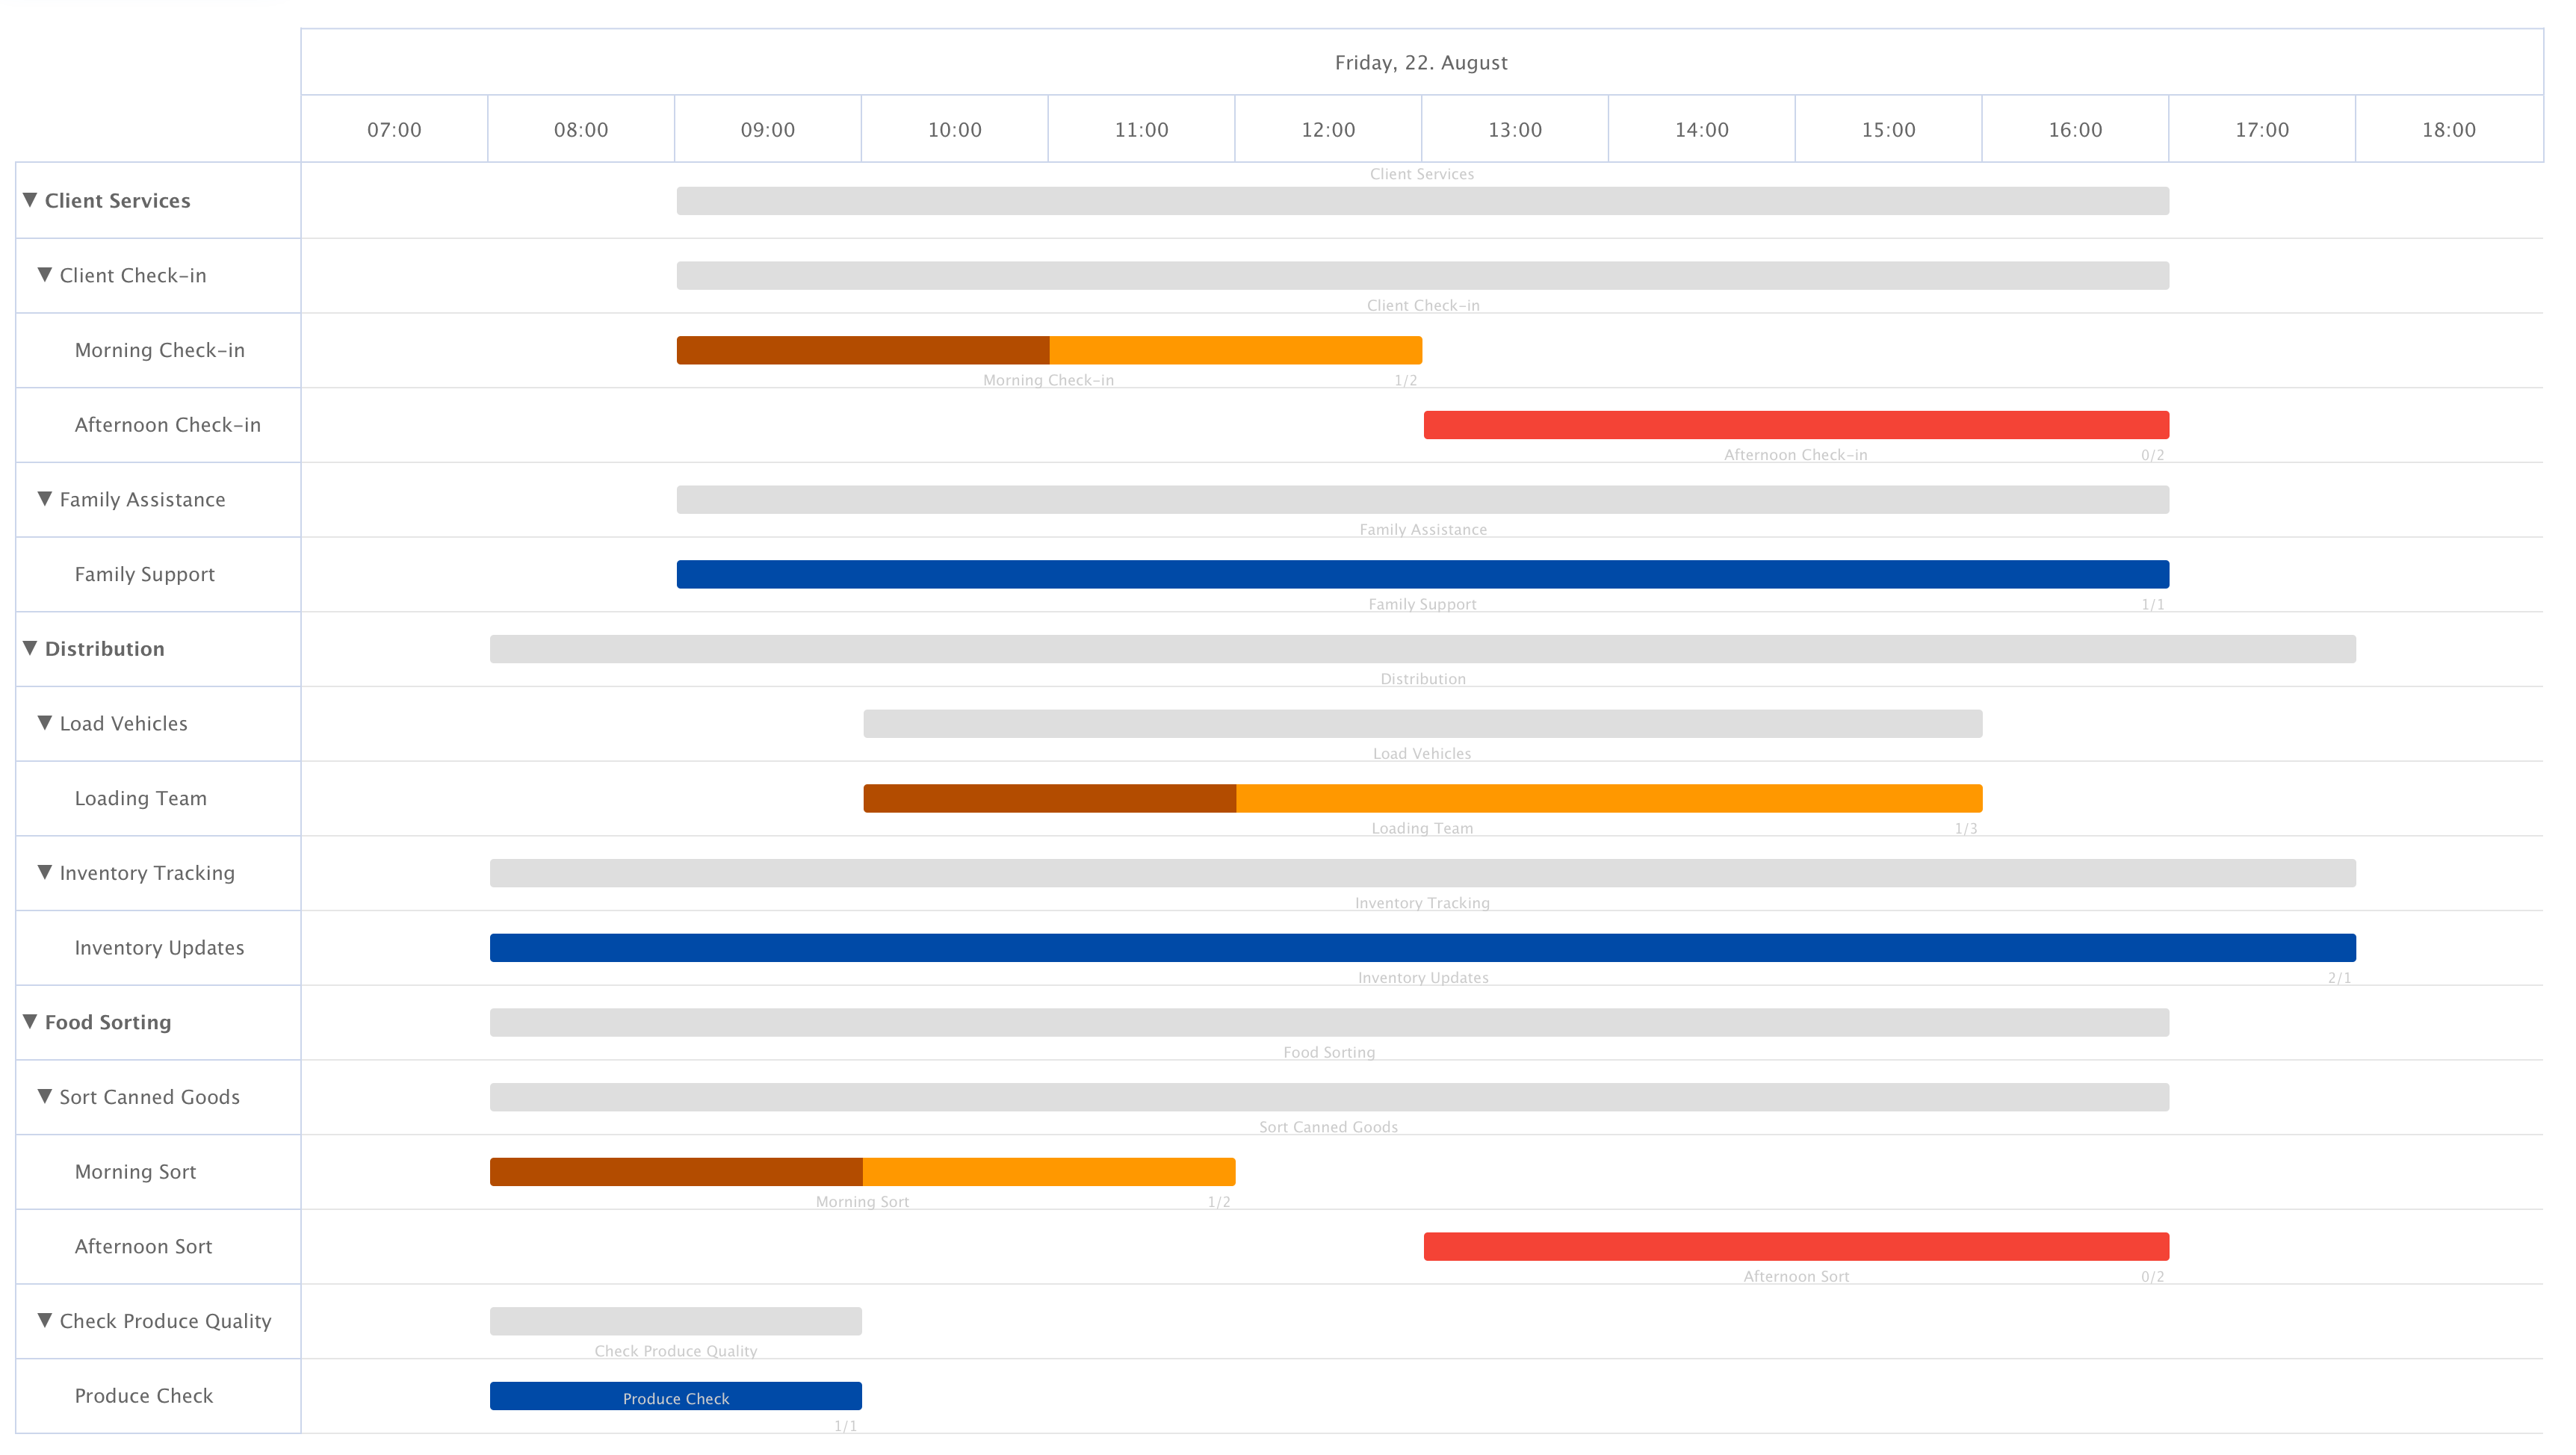
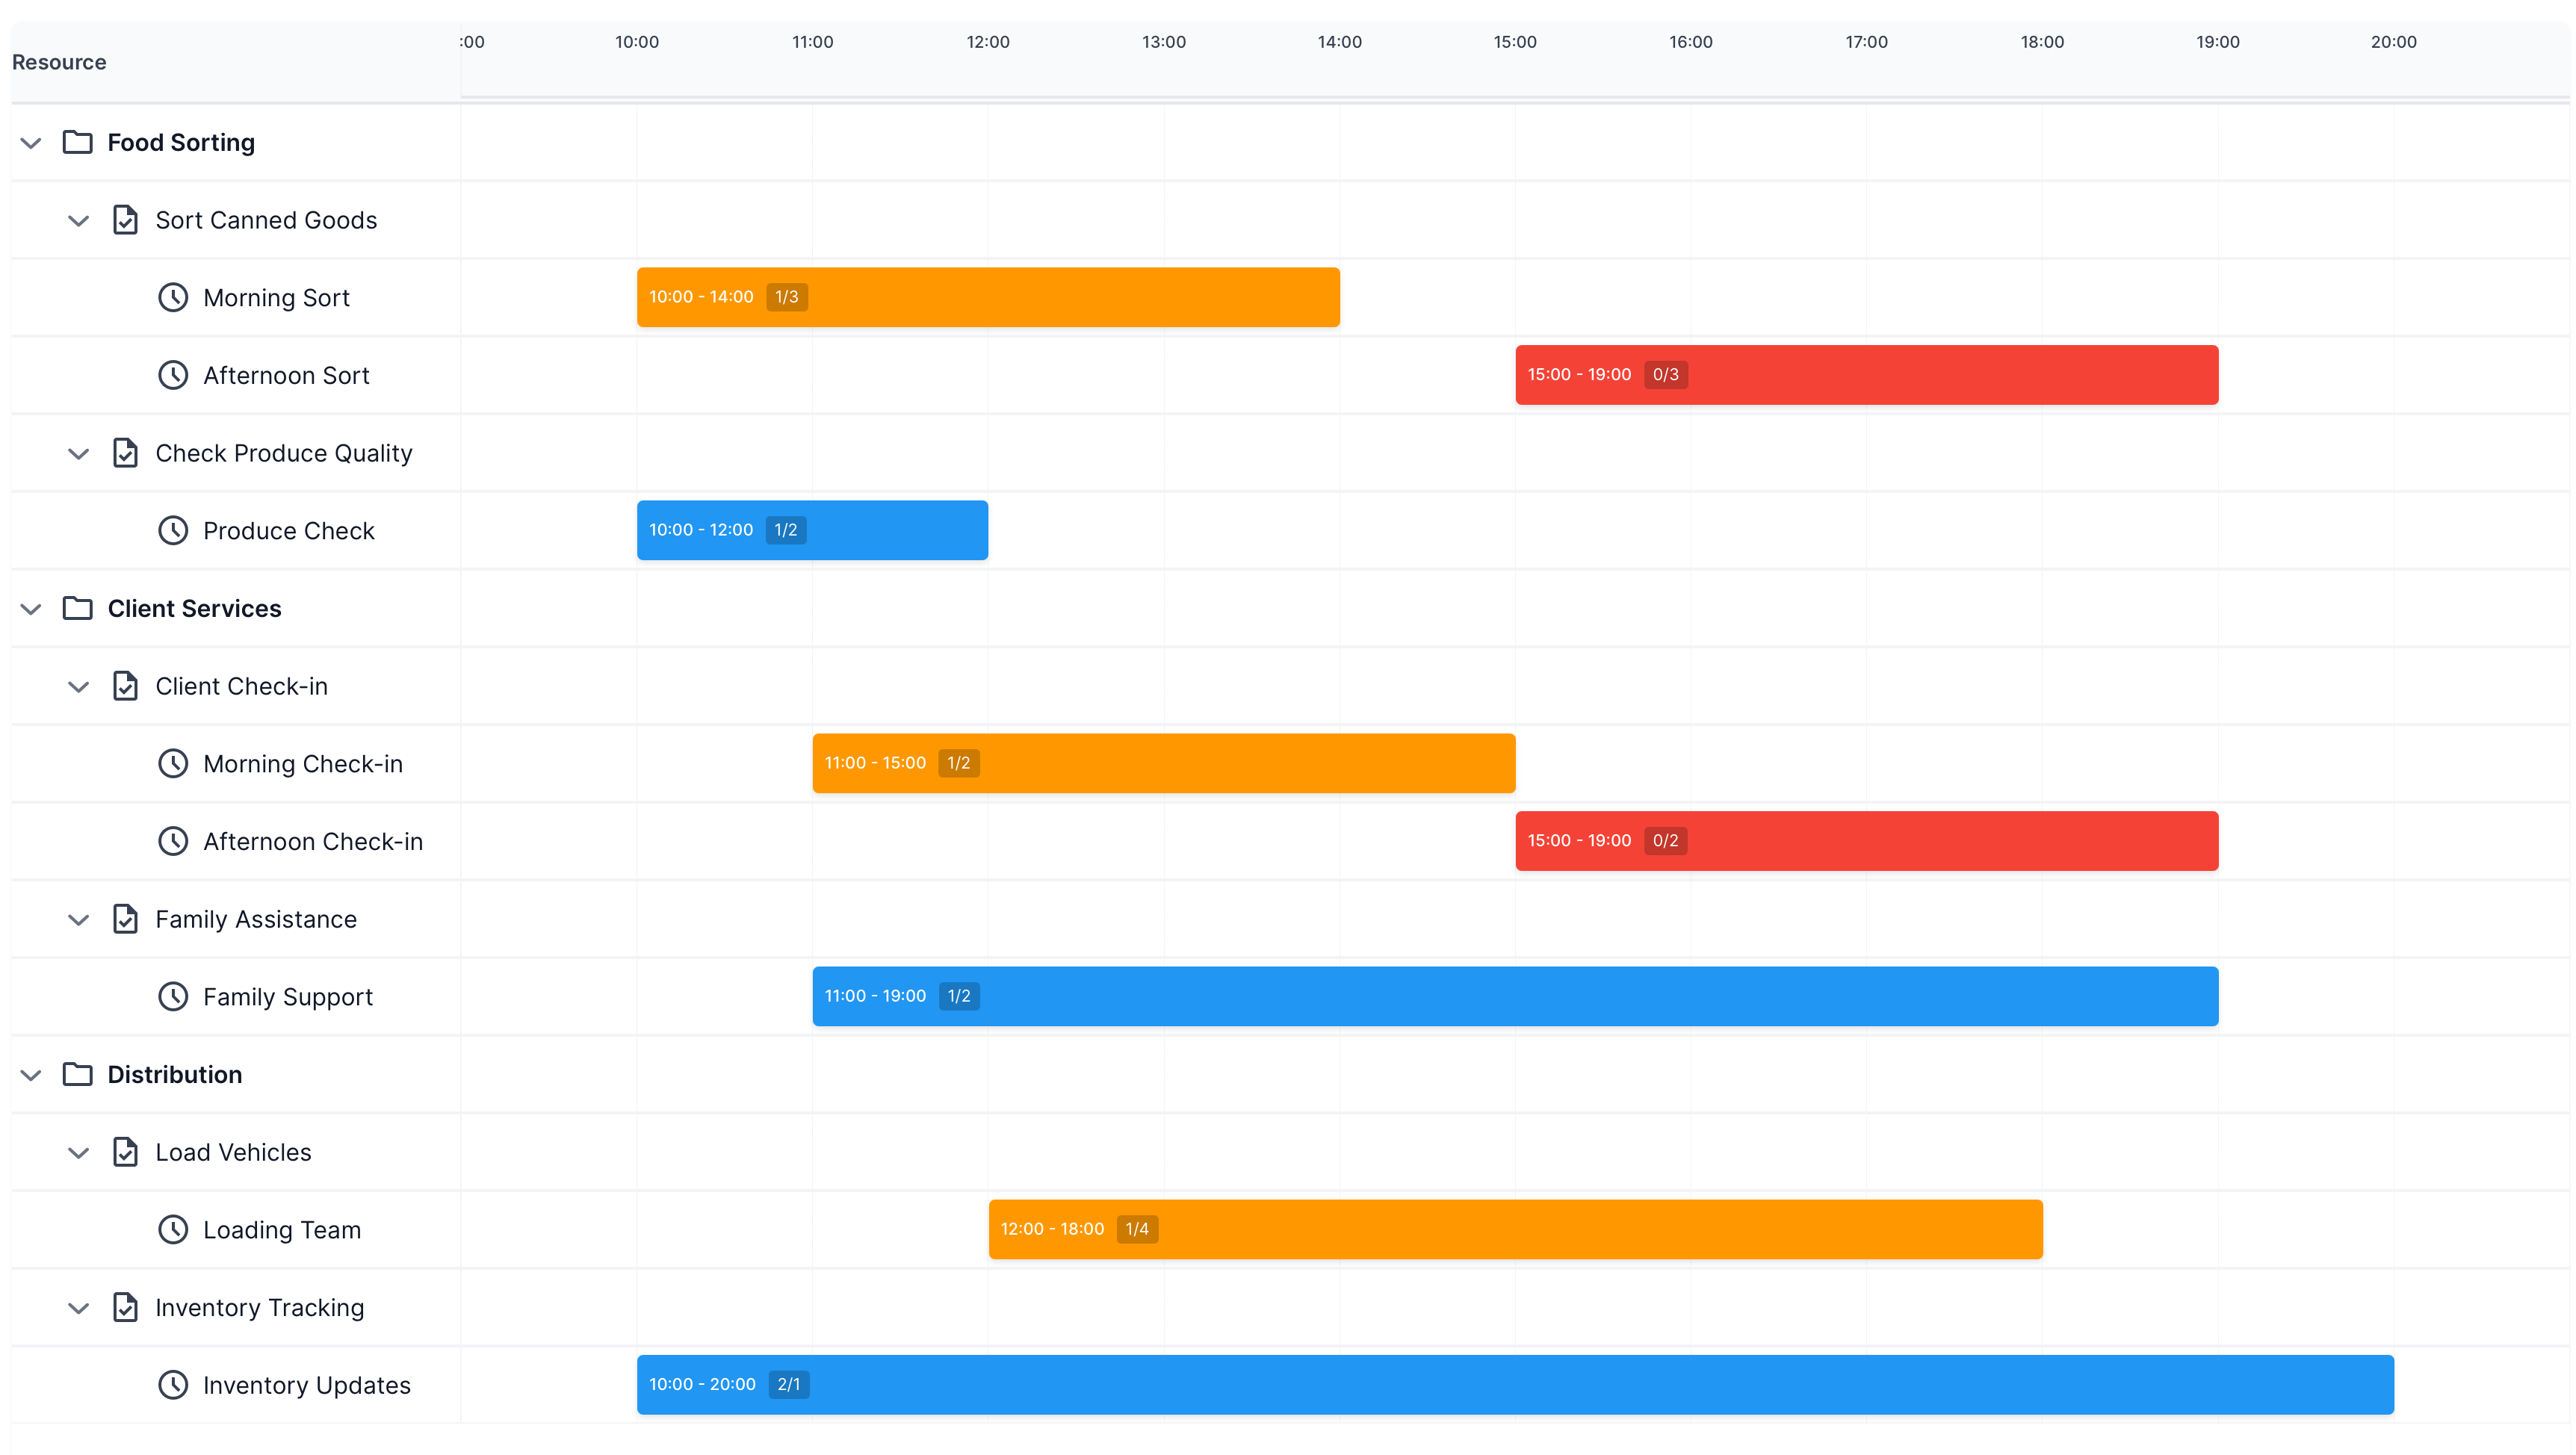
Below the current chart. I would like to have the first two levels only as thin lines and not draggable.
This should be possible according to: Grouping tasks in a hierarchy | Highcharts
I’ve been playing around with it for two days now and think I’m probably going to implement something on my own that fits my requirements.
Just a guess: The used Highchart version might be too old to support it… this is going to change in Vaadin 25. The flow-components component / item is currently missing the highchart property pointWidth… this is either a bug/forgotten or not present in the old version
I will stay away from the Gantt Chart. Claude Code created a much better solution in a few minutes using a TreeGrid. This. can be customized to my needs.
@SimonMartinelli now you got me curious… Grid does not support colspan as far as I remember… how did you get the timeslots to span multiple columns? Or is it a single big column with styling?