12.4. Debug and Production Mode
Vaadin applications can be run in two modes: debug mode and production mode. The debug mode, which is on by default, enables a number of built-in debug features for the developers. The features include:
- Debug Window for accessing debug functionalities
- Display debug information in the Debug Window and server console.
- button that analyzes the layout for possible problems.
All applications are run in the debug mode by default (since IT Mill Toolkit
version 5.3.0). The production mode can be enabled, and debug mode thereby
disabled, by adding a productionMode=true parameter to
the servlet context in the web.xml deployment descriptor:
<context-param>
  <description>Vaadin production mode</description>
  <param-name>productionMode</param-name>
  <param-value>true</param-value>
</context-param>
Enabling the production mode disables the debug features, thereby preventing users from easily inspecting the inner workings of the application from the browser.
Running an application in the debug mode enables the client-side Debug
Window in the browser. You can open the Debug Window by adding
"?debug" to the application URL, for example,
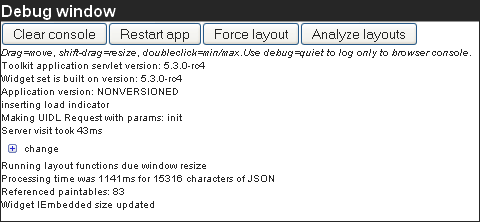
http://localhost:8080/myapp/?debug. The Debug Window, shown in
Figure 12.6, “Debug Window”, consists of buttons controlling the
debugging features and a scrollable log of debug messages.
- Clears the log in the Debug Window.
- Restarts the application.
- Causes all currently visible layouts to recalculate their appearance. Layout components calculate the space required by all child components, so the layout appearance must be recalculated whenever the size of a child component is changed. In normal applications, this is done automatically, but when you do themeing or alter the CSS with Firebug, you may need to force all layouts to recalculate themselves, taking into account the recently made changes.
- This is described in the following section.
If you use the Firebug plugin in Mozilla Firefox, the log messages will
also be printed to the Firebug console. In such a case, you may want to
enable client-side debugging without showing the Debug Window with
"?debug=quiet" in the URL. In the quiet debug mode, log
messages will only be printed to the Firebug console.
The Analyze layouts button analyzes the currently visible layouts and makes a report of possible layout related problems. All detected layout problems are displayed in the log and also printed to the console.
The most common layout problem is caused by placing a component that has a
relative size inside a container (layout) that has undefined size, for
example, adding a 100% wide Panel inside a
HorizontalLayout with no width specification. In
such a case, the error will look as shown below:
Vaadin DEBUG
- Window/1a8bd74 "My window" (width: MAIN WINDOW)
  - HorizontalLayout/1cf243b (width: UNDEFINED)
    - Panel/12e43f1 "My panel" (width: RELATIVE, 100.0 %)
Layout problem detected: Component with relative width inside a HorizontalLayout with no width defined
Relative sizes were replaced by undefined sizes, components may not render as expected.
This particular error tells that the Panel "My
panel" is 100% wide while the width of the containing
HorizontalLayout is undefined. The components will
be rendered as if the the width of the contained
Panel was undefined, which might not be what the
developer wanted. There are two possible fixes for this case: if the
Panel should fill the main window horizontally, set
a width for the HorizontalLayout (for example 100%
wide), or set the width of the Panel to "undefined"
to render the it as it is currently rendered but avoiding the warning
message.
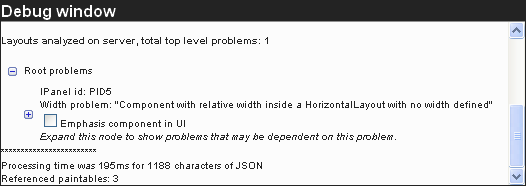
The same error is shown in the Debug Window in a slightly different form and with an additional feature (see Figure 12.7, “Debug Window Showing the Result of Analyze layouts.”). Checking the Emphasize component in UI box will turn red the background of the component that caused a warning, making it easy for the developer to figure out which component each warning relates to. The messages will also be displayed hierarchically, as a warning from a containing component often causes more warnings from its child components. A good rule of thumb is to work on the upper-level problems first and only after that worry about the warnings from the children.
CustomLayout components can not be analyzed in the
same way as other layouts. For custom layouts, the button analyzes all contained relative-sized
components and checks if any relative dimension is calculated to zero so
that the component will be invisible. The error log will display a warning
for each of these invisible components. It would not be meaningful to
emphasize the component itself as it is not visible, so when you select
such an error, the parent layout of the component is emphasized if
possible.
You can take advantage of the debug mode when developing client-side
components. The static function
ApplicationConnection.getConsole() will return a
reference to a Console object which contains
logging methods such as log(String msg) and
error(String msg). These functions will print
messages to the Debug Window and Firebug console in the same way as other
debugging functionalities of Vaadin do. No messages will be
printed if the Debug Window is not open or if the application is running
in production mode.

