20.4. Using Vaadin TestBench Recorder
The Vaadin TestBench Recorder is used for recording and exporting JUnit test stubs that you can then develop further.
The most important role for using the Recorder is to identify all user interface elements that you want to test - you can do all other test logic by coding. The elements are identified by a selector, which usually use an HTML document path that selects the element. By default, the Recorder records the paths using a Vaadin selector, where the root of the path is the application element. The path can also be an XPath expression or a CSS selector. It can use a debug ID that you can set in the application code.
You can play back recoded test cases and use the Recorder to make assertions and take screenshots for screen capture comparison. Then, you export the test stubs as JUnit Java source files which you can then develop further.

The Recorder is available only for Mozilla Firefox. To run the recorded tests in other browsers, you need to export them as JUnit tests and launch the other browsers with the WebDriver, as described later.
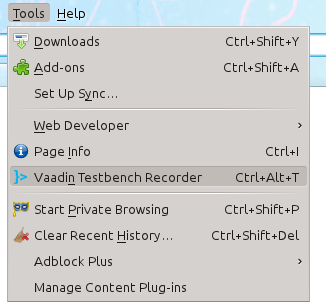
To start the Recorder:
-
Open Mozilla Firefox
-
Open the page with the application that you want to test
-
Select → in the Firefox menu
The Vaadin TestBench Recorder window will open, as shown in Figure 20.8, “Vaadin TestBench Recorder Running”.
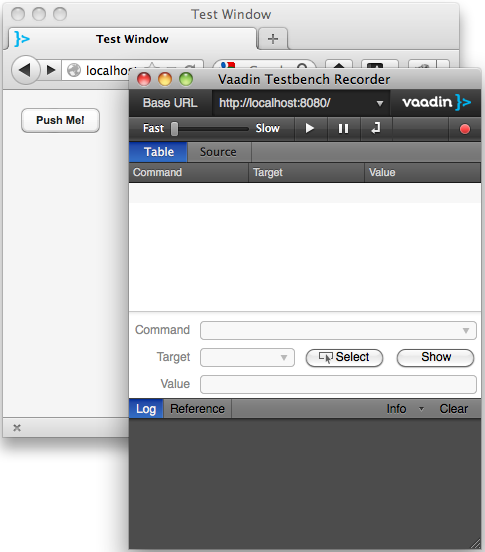
Recording is automatically enabled when the Recorder starts. This is
indicated by the pressed  button.
While recording, you can interact with the application in (almost) any way you like. The Recorder records the interaction as commands in a test script, which is shown in tabular format in the Table tab and as HTML source code in the Source tab.
Please note the following:
-
Changing browser tabs or opening a new browser window is not recommended, as any clicks and other actions will be recorded
-
Passwords are considered to be normal text input and are stored in plain text
While recording, you can insert various commands such as assertions or take a screenshot by selecting the command from the Command list.
When you are finished, click the
button to stop recording.
The Recorder supports various selectors that allow finding the HTML elements that are interacted upon and asserted. By default, Recorder uses the Vaadin selector, which finds the elements by an application identifier, a possible debug ID, and a component hierarchy path.
You can find elements by a plain XPath expression from the page root, an element ID, CSS style class, etc. The selectors are exported with the JUnit test cases as corresponding Vaadin or Selenium selector methods, described in Section 20.5.2, “Finding Elements by Selectors”.
Some selectors are not applicable to all elements, for example if an element does not have an ID or it is outside the Vaadin application. In such case, another selector is used according to a preference order. You can change the order of the preferred selectors by selecting → → and dragging the selectors (or locators) to a preferred order. Normally, the Vaadin selector should be at top.
After you have stopped recording, reset the application to the initial
state and press  to run the test again. You can use the
?restartApplication parameter for an application in
the URL to restart it.
You can also play back tests saved in the HTML format by first opening a test in the Recorder with → .
You can use the  slider to
control the playback speed, click to
interrupt the execution and to
continue. While paused, you can click to
execute the script step-by-step.
slider to
control the playback speed, click to
interrupt the execution and to
continue. While paused, you can click to
execute the script step-by-step.
Check that the test works as intended and no unintended or invalid commands are found; a test should run without errors.
While the primary purpose of using the Recorder is to identify all user interface elements to be tested, you can also edit the tests at this point. You can insert various commands, such as assertions or taking a screenshot, in the test script during or after recording.
You insert a command by selecting an insertion point in the test script and right-clicking an element in the browser. A context menu opens and shows a selection of Recorder commands at the bottom. Selecting shows more commands. Commands inserted from the sub-menu are automatically added to the top-level context menu.
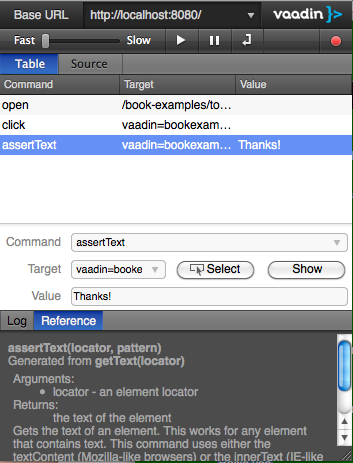
Figure 20.10, “Inserting commands in a test script” shows adding an assertion after clicking the button in the example application.
Inserting a command from the context menu automatically selects the command in the Command field and fills in the target and value parameters.
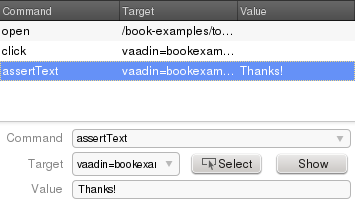
You can also select the command manually from the Command list. The new command or comment will be added at the selected location, moving the selected location down. If the command requires a target element, click Select and then click an element in your application. A reference to the element is shown in the Target field and you can highlight the element by clicking Show. If the command expects some value, such as for comparing the element value, give it in the Value field.
Commands in a test script can be changed by selecting a command and changing the command, target, or value.
Once you have are satisfied with a test case, you need to export it as a JUnit test case stub.
You can save a test by selecting → → .
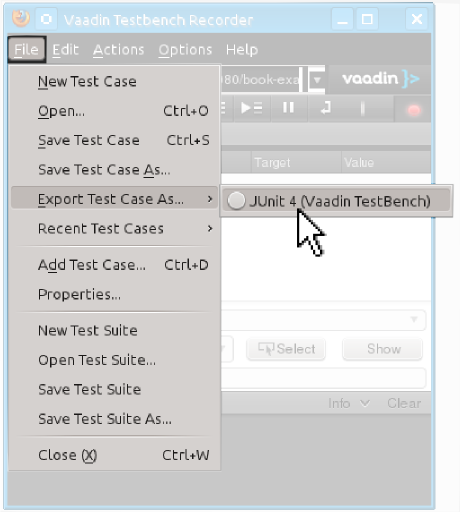
In the dialog that opens, enter a file name for the Java source file. The
file contains a Java class with name Testcase, so
you might want to name the file as Testcase.java. You
can rename the class later.
While exporting tests as JUnit tests is the normal case, the Recorder also allows saving test cases and test suites in a HTML format that can be loaded back in the Recorder. Vaadin TestBench does not support other use for these saved tests, but you may still find the feature useful if you like to develop test cases more with the Recorder.