I am running with Vaadin 6.x and using the Timeline addon - version 2.0.1-3. The graphs look fine, but on close examination, there is some inconsistency. If the graph has a large number of data points, I know it gets sampled, so not all the points are displayed. But as the cursor moves over the graph, the legend at the top shows the data point under the cursor - and that value does not always seem to be accurate. I can generate some screenshots, but they may be very hard to read. But in essence, I find that the the value shown in the legend does not correspond to what I see under the cursor. We have instances where the putting the cursor on what looks like a large value shows a legend value smaller than the legend for the point immediately to the right and left - even though the graph shows a peak in the middle.
Is this an artifact of the sampling algorithm? When I zoom in so that all the points in the window are being graphed, it looks like the legend values are correct. Is it possible to have the legend select its values only from the points that are being sampled?
I hope this question makes sense… Let me know if more explanation is needed…
I think I understand what you mean and it’s probably due to the sampling/scaling of the data. Could you provide a simple example of where the misalignment happens? It would help us improve on the alignment in future releases.
Don’t think I have a simple example - but I will try to take a couple of screendumps and upload them later today or tomorrow for you. I have also noticed an issue with Max/Min values on the charts - I will try to get more details before I ask about that one tho…
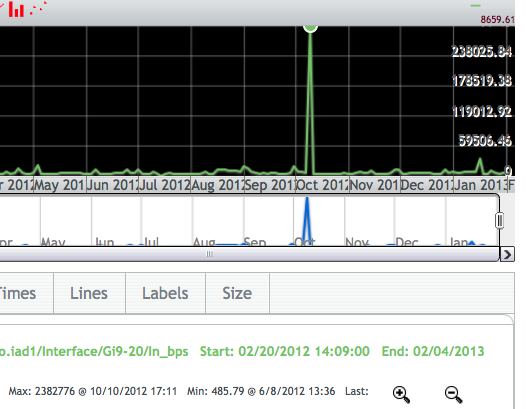
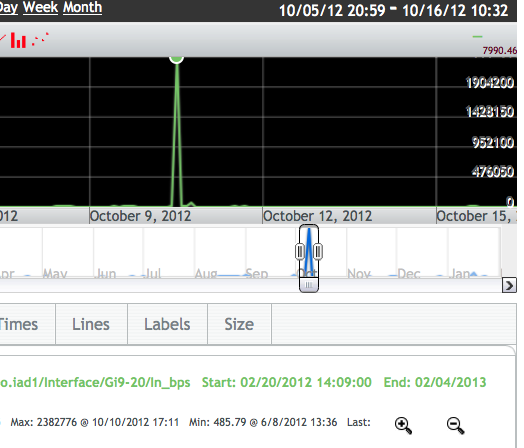
Here are 2 screenshots from a Timeline graph - the first one shows the entire graph (12 months worth of data - I downsampled it to around 8000 data points). The second screenshot is the same data, but zoomed in to the max value of the chart - you can see that the legend value is incorrect (and different) for both pictures.
Hope that helps - let me know if you need something more from me
Thanks - Can you tell if this is going to be an issue for the Chart add-on in Vaadin 7? I’m going to a training class for Vaadin 7 next week in Chicago, and I hope to start migrating my code to the new libraries after that - but I gather that the Timeline module is not being used in the new release…
Timeline is a part of Vaadin Charts for Vaadin 7 and with minimal API changes, so you should be able to migrate that part of your code without much trouble.