Hi All,
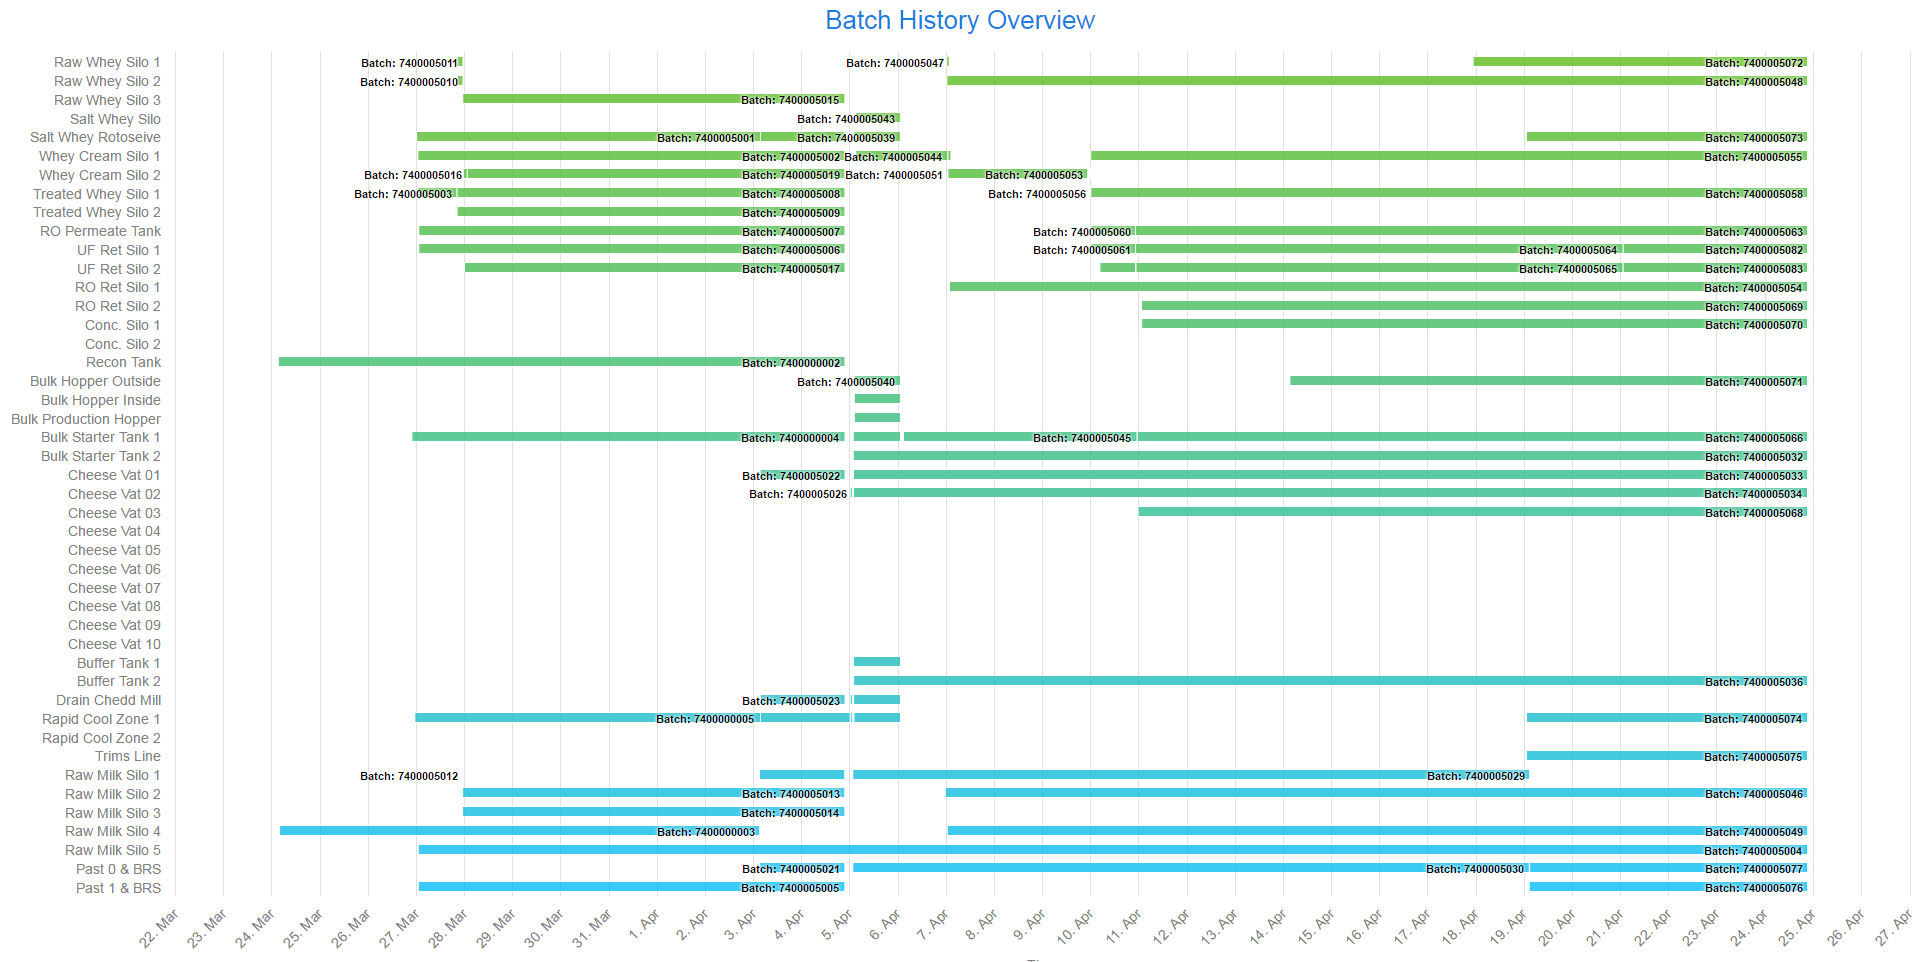
I Am working on a tool that will help me visualize the time product stays in a container. Each time the container is cleaned and new product is put into it it creates a new “Batch” the start and end of a batch is what the chart shows for several contaiers.
I have been experimenting with the ColumnRange Chart as it was demonstrated on the Vaadin Charts Demo.
My Big issue is the attached imagine shows only 2 months of testing data without a way to specify the range it will not be possible to show a years worth of data.
I have tried enabling the the Range Selector and Navigator in the configuration with no luck. A simple question are those features only available on the Timeline Chart.
Second Question:
With the example picture attached is there a better way to accomplish this same effect in Vaadin a different way.
I look forward to any thoughts and suggestions