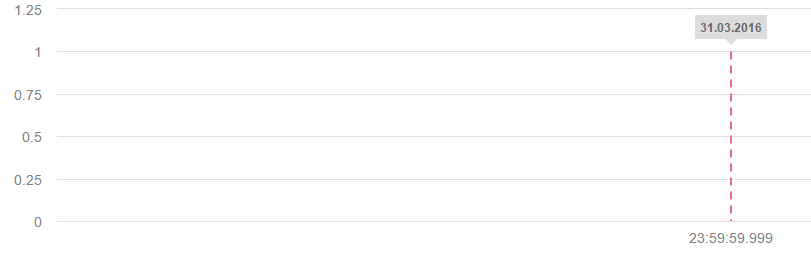
inside of my chart I want to show a vertical, dotted line that marks basically a certain date (e.g. today).
My approach was to add a series with 2 points, render it as a line and added a DataLabel (callout).
This is the current result:
Unfortunately I am stuck at the following point:
I want to hide the tickmark (and according label) on the x axis for this series only
I do not want a tooltip if hovering a datapoint (I looked into the class SeriesToolTip, unfortunately it has no setEnabled() method)
Does someone know a solution to this? Or do I even need a completely other approach?
EDIT:
Tickmark problem has been solved by adding a new xAxis, associating the series with it and hiding the axis.
EDIT 2:
Unfortunately the second axis does not work, as now of course the position is not related to the other axis anymore.
Hello, JDC.
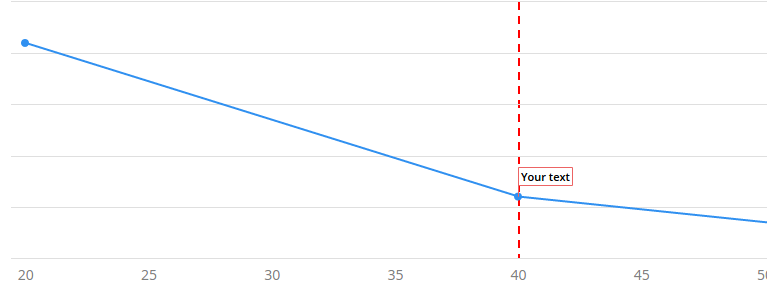
May be you should look into a PlotLine class. Unfortunatelly you can’t cut the plot line, so it always goes up to the top edge of the chart. It’s not looking exactly as you want, but may be you can find some helpful options there.
PlotLine plotLine=new PlotLine();
plotLine.setColor(SolidColor.RED);
plotLine.setDashStyle(DashStyle.DASH);
plotLine.setWidth(2); plotLine.setValue(40);
configuration.getxAxis().addPlotLine(plotLine);
Hello, thanks for the hint. Unfortunately I can’t get this to work with an axis of type DATETIME. What do I need to set for the value? Date().getTime() ?
I have seen this method:
Util.toHighchartsTS(date)
Do I need to convert the value first?
EDIT:
I’ve found the poblem:
Unfortunately the plotlins not taken into acount for the charts range (min, max).
You have to use setMax() if the plotline exceeds the range of the axis.